Introduction.
After taking the measurements, you can see your reasults with the program "AnalyseSurface".
How to start "AnalyseSurface".
On the desktop you can see the shortcut of this software : ![]() Double click on this icon and the software "AnalyseSurface" starts.
Double click on this icon and the software "AnalyseSurface" starts.
The software "AnalyseSurface".
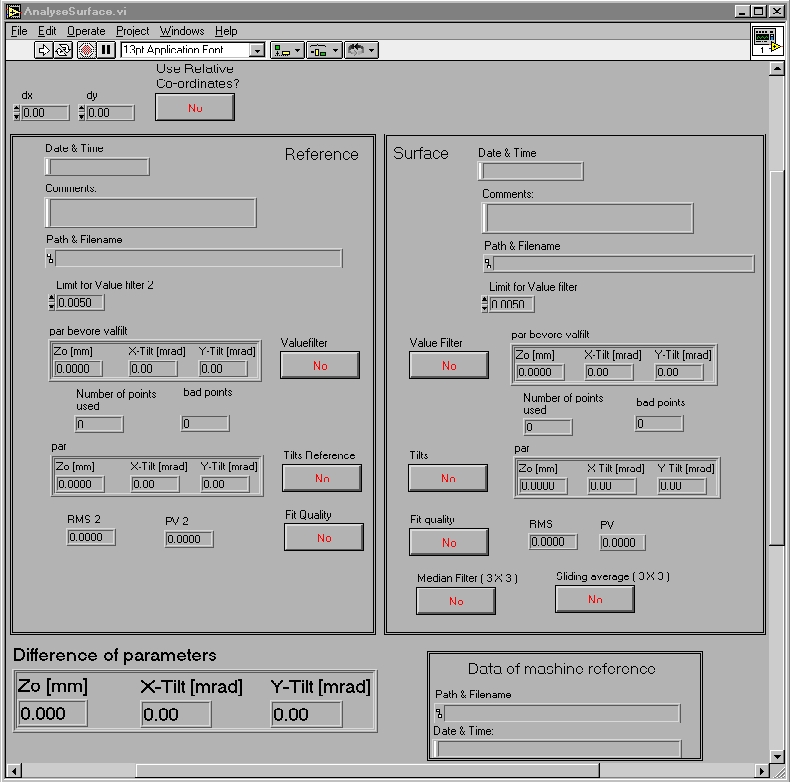
When you start this software you will see this window :
Before starting this program, you must click on the red button to choose your options.
Some explanation.
To use this software you must make two measurements of the same surface with the same characteristics. The position and the parameters you use in the software ScanArea3 must be identical. The first surface will be used as reference and the second will be the surface you want to study. The software will make the comparison and will give you the differences.
The differents panel's parts.
As you can see on the Figure 1, there are several parts :
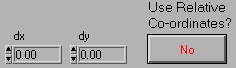 |
Gives you the possibility to use the relatives coordinates. |
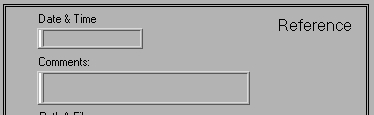 |
On this part there will be the reference surface (you will choose one of the two measured surfaces ). |
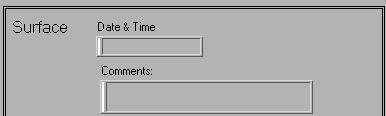 |
Here you will enter the second surface. |
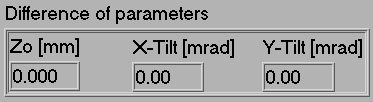 |
The software will give you the difference between the two surfaces. |
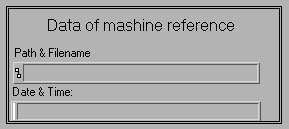 |
The software informes you which reference file it uses (Actually you haven't got the possibility to choose your reference file). |
The informations to supply.
As you can see on the Figure 1 there are 9 red buttons.
|
If you want to use relative coordinates enter the values in the dx and dy boxes and click on "No". This will speed up the function and the word "Yes" will appear on the button. |
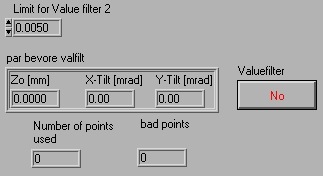 |
Limit for value filter 2 : The software suppresses the values on the Z axis which are under or over the limit with regard to the reference point. par bevore valfilt : Gives you information concerning the tilt of your surface before the suppressions of the bad points. Number of points used, bad points : Information given by the software. Valuefilter : Click here to speed up the function. |
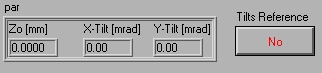 |
par : Gives you information concerning the tilt of your surface after the suppression of the bad points. Tilts Reference : Click here to speed up the function. |
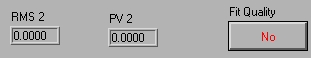 |
RMS 2, PV 2 : Gives you information concerning these values. Fit Quality : Click here to speed up the function. |
 |
Median Filter : The median filter can be need to give a graphic representation of your surface. |
 |
Sliding average : Use the sliding average and gives you a graphic representation. |
Start the software "AnalyseSurface".
After giving to the software the necessary information, open the menu "Operate", and click on "Run". There is a shortcut in this window, it's the white arrow : ![]() that you can see under the menu "Edit" on the left.
that you can see under the menu "Edit" on the left.
Load the second surface.
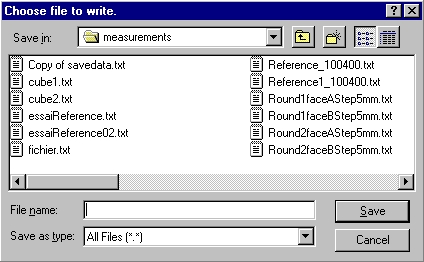
The software opens a dialog box to choose the file surface (see Figure 2).
| Before opening the files, you must verify in the files that the first measured point is correct (Sometime the X axis of the first point is wrong. You must change this value). Afterwards, you must remove the last empty line at the end of the file. Don't forget that you must enter the second surface before the reference surface. |
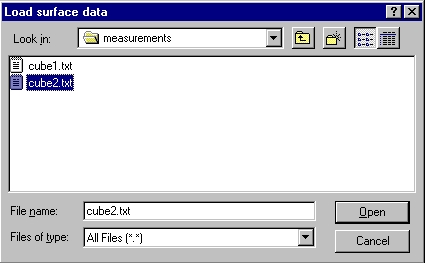
For example we take the file cube2.txt in the directory d:\measurements.
- Chose your file surface and click "Open".
Load the reference surface.
The software will open a second dialog box to choose the reference surface (see Figure 3).
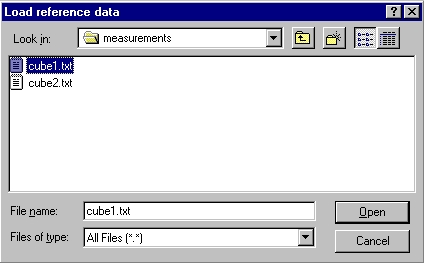
For example I take the file cube1.txt in the directory d:\measurements.
- Choose your file reference surface and click "Open".
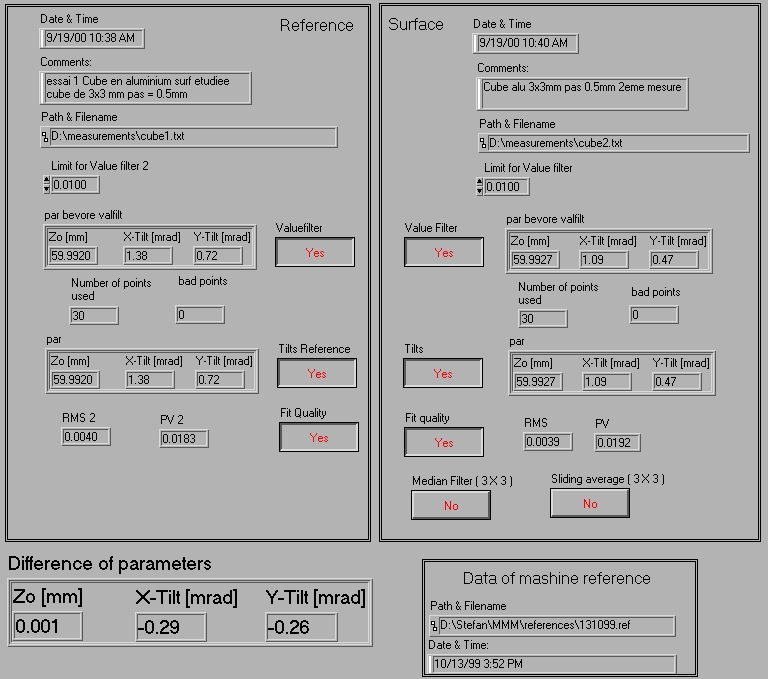
Results on the panel "AnalyseSurface"
After a few moments you will be able to read the information on the panel "AnalyseSurface" (see Figure 4) :
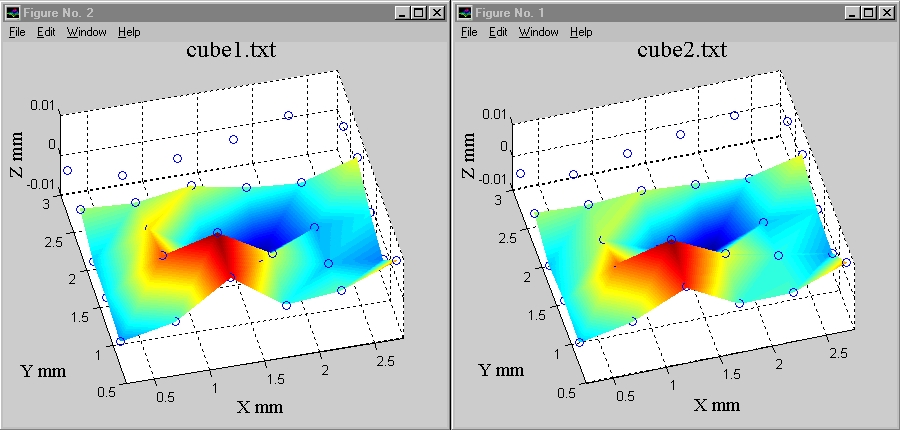
Graphs results.
And see the results on the graphs like Figure 5 :
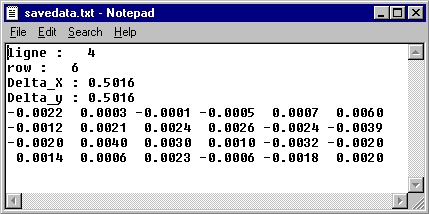
Save Data Z.
The software opens a window to save the data Z of "Surface".
Enter in the box "File name:" the name of the file. This function permits you to save the data Z in a matrix. Here is an example of this file :