Science with VISIR
Publications:
Data resources:
For authors:
- If you are using data from this instrument in your paper, please see the ESO Data Citation Policy. ESO Data Citation Policy linked with http://www.eso.org/sci/observing/policies/publications.html
Image gallery
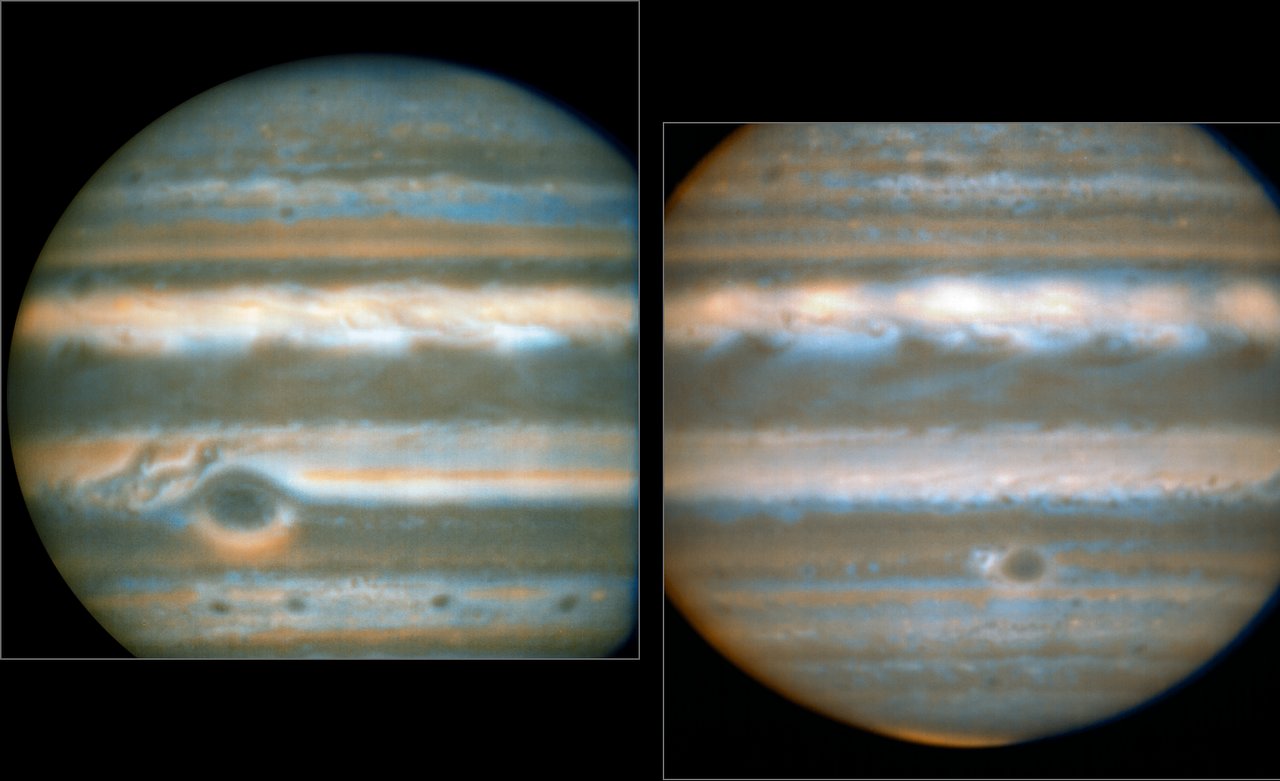 |
False colour images generated from VISIR observations in February and March 2016, showing two different faces of Jupiter. The orange images were obtained at 10.7 micrometres wavelength and highlight the different temperatures and presence of ammonia. The blue images at 8.6 micrometres highlight variations in cloud opacity. See eso1623. |
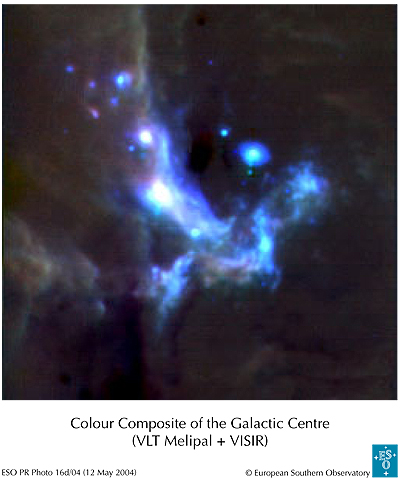 |
The Galactic Centre: Color composite using filters centred at 8.6μm (Polycyclic Aromatic Hydrocarbon molecular feature - coded blue), 12.8μm ([NeII] - coded green) and 19.5μm (coded red). Each pixel subtends 0.127 arcsec and the total field is ~ 33 x 33 arcsec with North at the top and East to the left. Total integration times were 300, 160 and 300 s for the 3 filters, respectively. |
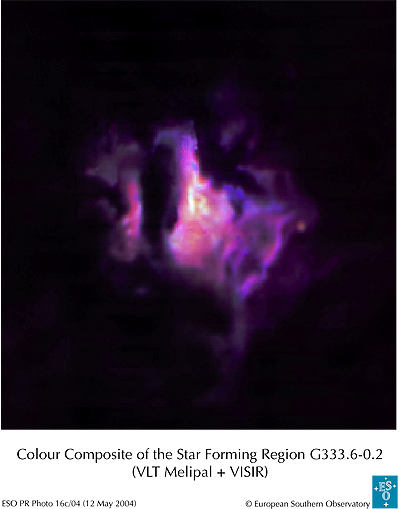 |
The G333.6-0.2 star-forming region: Color composite using filters centred at 11.3μm (one of the Polycyclic Aromatic Hydrocarbon features, coded blue), 12.8 μm (an emission line of [NeII], coded green) and 19μm (warm dust emission, coded red). Each pixel subtends 0.127 arcsec and the total field is ~ 33 x 33 arcsec with North at the top and East to the left. The total integration times were 13 seconds at the shortest and 35 seconds at the longer wavelengths. |
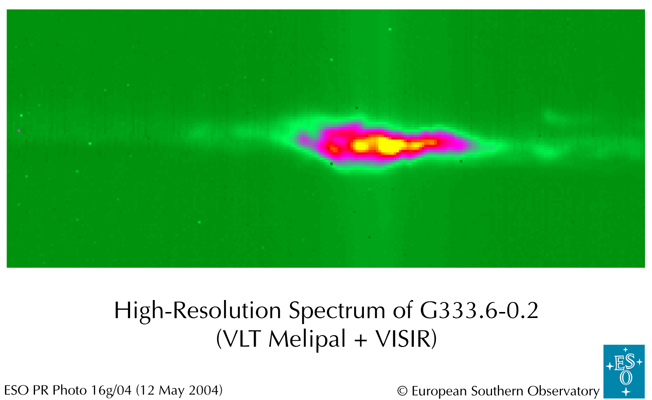 |
High-resolution spectrum of the NeII line at 12.8135 μm of the star-forming region G333.6-0.2. The images are 256 x 256 frames of 50 x 50 micron pixels. The "field" direction is horizontal, with total slit length of 32.5 arcsec; North is left and South is to the right. The dispersion direction is vertical, with the wavelength increasing downward. The total integration time was 80 sec. |
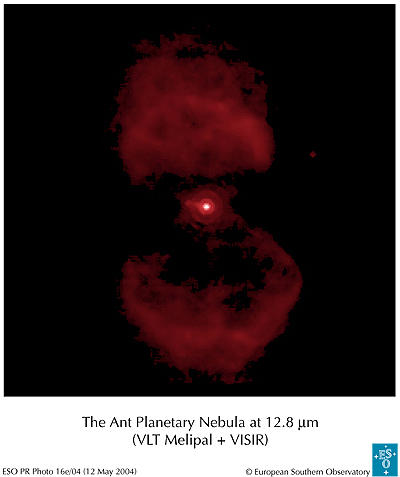 |
The Ant Planetary Nebula (Mz3) in the narrow-band filter centred at wavelength 12.8 μm. The scale is 0.127 arcsec/pixel and the total field-of-view is 33 x 33 arcsec, with North at the top and East to the left. The total integration time was 200 seconds. |
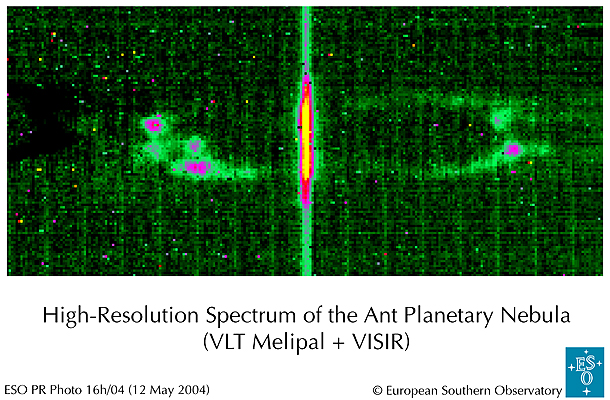 |
High-resolution spectrum of the NeII line at 12.8135 μm of the Ant Nebulae. The images are 256 x 256 frames of 50 x 50 micron pixels. The "field" direction is horizontal, with total slit length of 32.5 arcsec; North is left and South is to the right. The dispersion direction is vertical, with the wavelength increasing downward. The total integration time was 120 sec. |
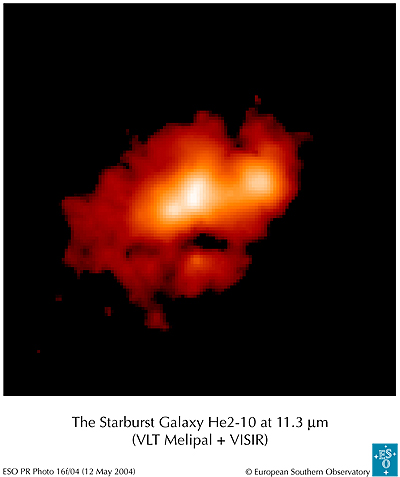 |
The starburst galaxy He2-10 at wavelength 11.3 μm. The scale is 0.127 arcsec per pixel and the full field covers 15 x 15 arcsec with North at the top and East on the left. The total integration time for this observation is one hour. |
