| This documentation is intended both for QC scientists and SciOps astronomers (who may want to ignore the technical information displayed in grey). | ||||||||||||||||||||||||||||
|
||||||||||||||||||||||||||||
| bottom plots | contact | ||||||||||||||||||||||||||||
| NAME | lamp_lss_qc.prg | |||||||||||||||||||||||||||
| VERSION | 2.0 -- adapted for WAVE and FLAT for new pipeline | |||||||||||||||||||||||||||
| SYNTAX | MIDAS | |||||||||||||||||||||||||||
| CALL |
measureQuality from $DFS_PRODUCT/LAMP_LSS/$DATE: inmidas -P -j "@@ $DFO_PROC_DIR/lamp_lss_qc.prg $date $PF" | |||||||||||||||||||||||||||
| INSTRUMENT | FORS2 | |||||||||||||||||||||||||||
| RAWTYPE | LAMP_LSS | |||||||||||||||||||||||||||
| PURPOSE | compares raw and product WAVE and FLAT files for FORS2 QC assessment; the plots are later reviewed within certifyProducts. The plots are stored as Postscript file in $DFO_PLT_DIR. | |||||||||||||||||||||||||||
| PROCINPUT |
first raw flat and arc from AB; products: resolution table, reduced arc image, delta image, disp residuals table, wavemap image; master screen flat and normalized master flat | |||||||||||||||||||||||||||
| QC1TABLE |
trending | table(s) in QC1 database: fors2_lss_wave | |||||||||||||||||||||||||||
| TRENDPLOT |
trending | HealthCheck plot(s) associated to this procedure: trend_report_LSS_lambda_c_HC.html | trend_report_LSS_lambda_c_T_HC.html | trend_report_LSS_resolution_HC.html | trend_report_LSS_nwave_HC.html | |||||||||||||||||||||||||||
| QC1PAGE |
trending | associated documentation: lsswlc/lsswlc.html | |||||||||||||||||||||||||||
| QC1PLOTS top |
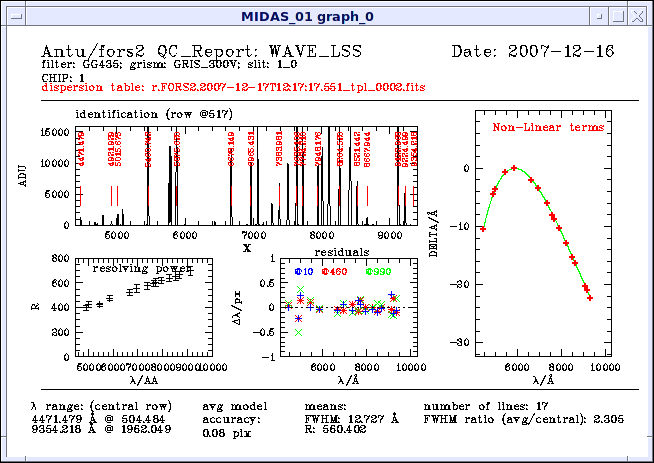
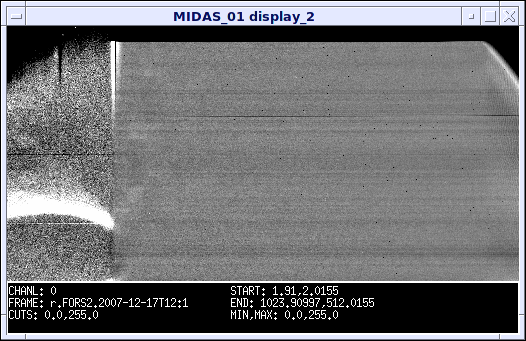
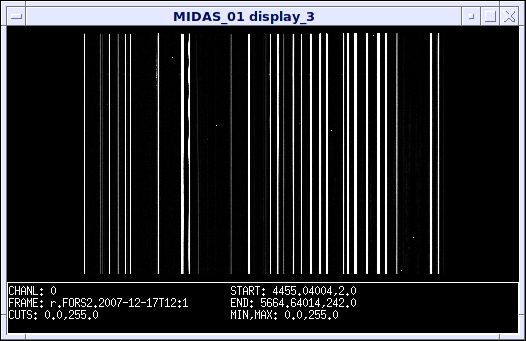
lamp_lss_grap1.png top left: line identifications in reduced arc frame lower left: resolving power; lower right: residuals for row at bottom, center and top (in Angstroem) Sometimes the arc lines were not detected in all rows, so some of the coloured symbols may be missing. right: non-linear terms of fit and deviations from linear fit Sometimes the arc lines were not detected in all rows, so there may be no red crosses. Then the reduced arc lamp should be checked very carefully. top panel: date; name of disp residuals table (red), setup parameters (filter, grism, slit, chip) bottom panel: some QC1 parameters - wavelength range of central row, average residuals; mean resolution and FWHM, average number of lines identified lamp_lss_grap2.png left, top row: rows and columns of normalized master flat (full range) left, bottom row: rows and columns of normalized master flat (central part) right: central row (top) and column (bottom) of master screen flat; top panel: date; name of normalized master flat field (red), setup parameters (filter, grism, slit, ship), number of frames bottom panel: range in x over which master screen flat field has more than 10000 ADU in central row and the S/N for that range lamp_lss_disp1.png full display of reduced arc frame lamp_lss_disp2.png full display of normalized master flat | |||||||||||||||||||||||||||
| QC1PARAM |
QC1 parameters written into QC1 table: QC1db names: wave_min | wave_max | x_min | x_max FITS key names: (lamp_lss_qc.prg) | (lamp_lss_qc.prg) | (lamp_lss_qc.prg) | (lamp_lss_qc.prg) QC1db names: n_lin |avg_accuracy | sig_accuracy | disp FITS key names: (lamp_lss_qc.prg) | QC.WAVE.ACCURACY | QC.WAVE.ACCURACY.ERROR | (lamp_lss_qc.prg) QC1db names: central_wlen | central_resol | central_resol_rms | nlines_total FITS key names: QC.LSS.CENTRAL.WAVELENGTH | QC.LSS.RESOLUTION | QC.LSS.RESOLUTION.RMS | QC.LSS.RESOLUTION.NLINES QC1db names: central_resol_meanrms | nwave FITS key names: QC.LSS.RESOLUTION.MEANRMS | QC.LSS.RESOLUTION.NWAVE | |||||||||||||||||||||||||||
| ALGORITHM |
Description of algorithms: wave_min: shortest wavelength of identified arc lines in central CCD row wave_max: longest wavelength of identified arc lines in central CCD row x_min: pixel position of shortest wavelength of identified arc lines in CCD central row x_max: pixel position of longest wavelength of identified arc lines in central CCD row n_lin: average number of identified arc lines per CCD row disp: mean dispersion in central row | |||||||||||||||||||||||||||
| CERTIF |
Reasons for rejection: - only 1 flat field (daily HC monitoring, 300V 0.3") - unusual shape of non-linear terms (e.g. double peak/valley; - curved or slanted lines in the reduced arc image; - wrong flux distribution in master screen flat (e.g. missing double peak for 300V) | |||||||||||||||||||||||||||
| COMMENTS | ||||||||||||||||||||||||||||
| top | [2015-11-05T15:13:42] created by qcDocu v1.1.2, a tqs tool | |||||||||||||||||||||||||||