| This documentation is intended both for QC scientists and SciOps astronomers (who may want to ignore the technical information displayed in grey). | ||||||||||||||||||||||||||||
|
||||||||||||||||||||||||||||
| bottom plots | contact | ||||||||||||||||||||||||||||
| NAME | flat_blue.prg | |||||||||||||||||||||||||||
| VERSION | 2.0 | |||||||||||||||||||||||||||
| SYNTAX | MIDAS | |||||||||||||||||||||||||||
| CALL |
from $DFS_PRODUCT/BIAS_RED/$DATE: uves.MeasureQuality -a <AB> -c flat_blue.prg [-i|--NOingestQC1pars] where
| |||||||||||||||||||||||||||
| INSTRUMENT | UVES | |||||||||||||||||||||||||||
| RAWTYPE | EFLAT_ECH_BLUE, DFLAT_ECH_BLUE & TFLAT_ECH_BLUE | |||||||||||||||||||||||||||
| PURPOSE |
Comparison of raw, master and/or reference EFLAT_ECH_BLUE, DFLAT_ECH_BLUE, IFLAT_ECH_BLUE & TFLAT_ECH_BLUE files
for UVES QC assessment;
QC1 values are calculated and fed into the QC1 table.
QC1 plot(s) and/or display(s) are generated,
and later reviewed within certifyProducts. The generated plots stored in $DFO_PLT_DIR/$DATE with the name r.<DPid>_tpl_0000.fits.png where <DPid> is the Data Product Identification of the first frame of the template. | |||||||||||||||||||||||||||
| PROCINPUT | first and second RAW frames from AB; MASTER_[E|D|T]FLAT_BLUE products | |||||||||||||||||||||||||||
| QC1TABLE |
trending | table(s) in QC1 database: uves_flat | |||||||||||||||||||||||||||
| TRENDPLOT |
trending | HealthCheck plot(s) associated to this procedure: HEALTH/trend_report_ECH_LAMPS_Stability_OD+FF_DHC_HC.html | |||||||||||||||||||||||||||
| QC1PAGE |
trending | associated documentation: lamps_qc1.html | |||||||||||||||||||||||||||
| QC1PLOTS top |
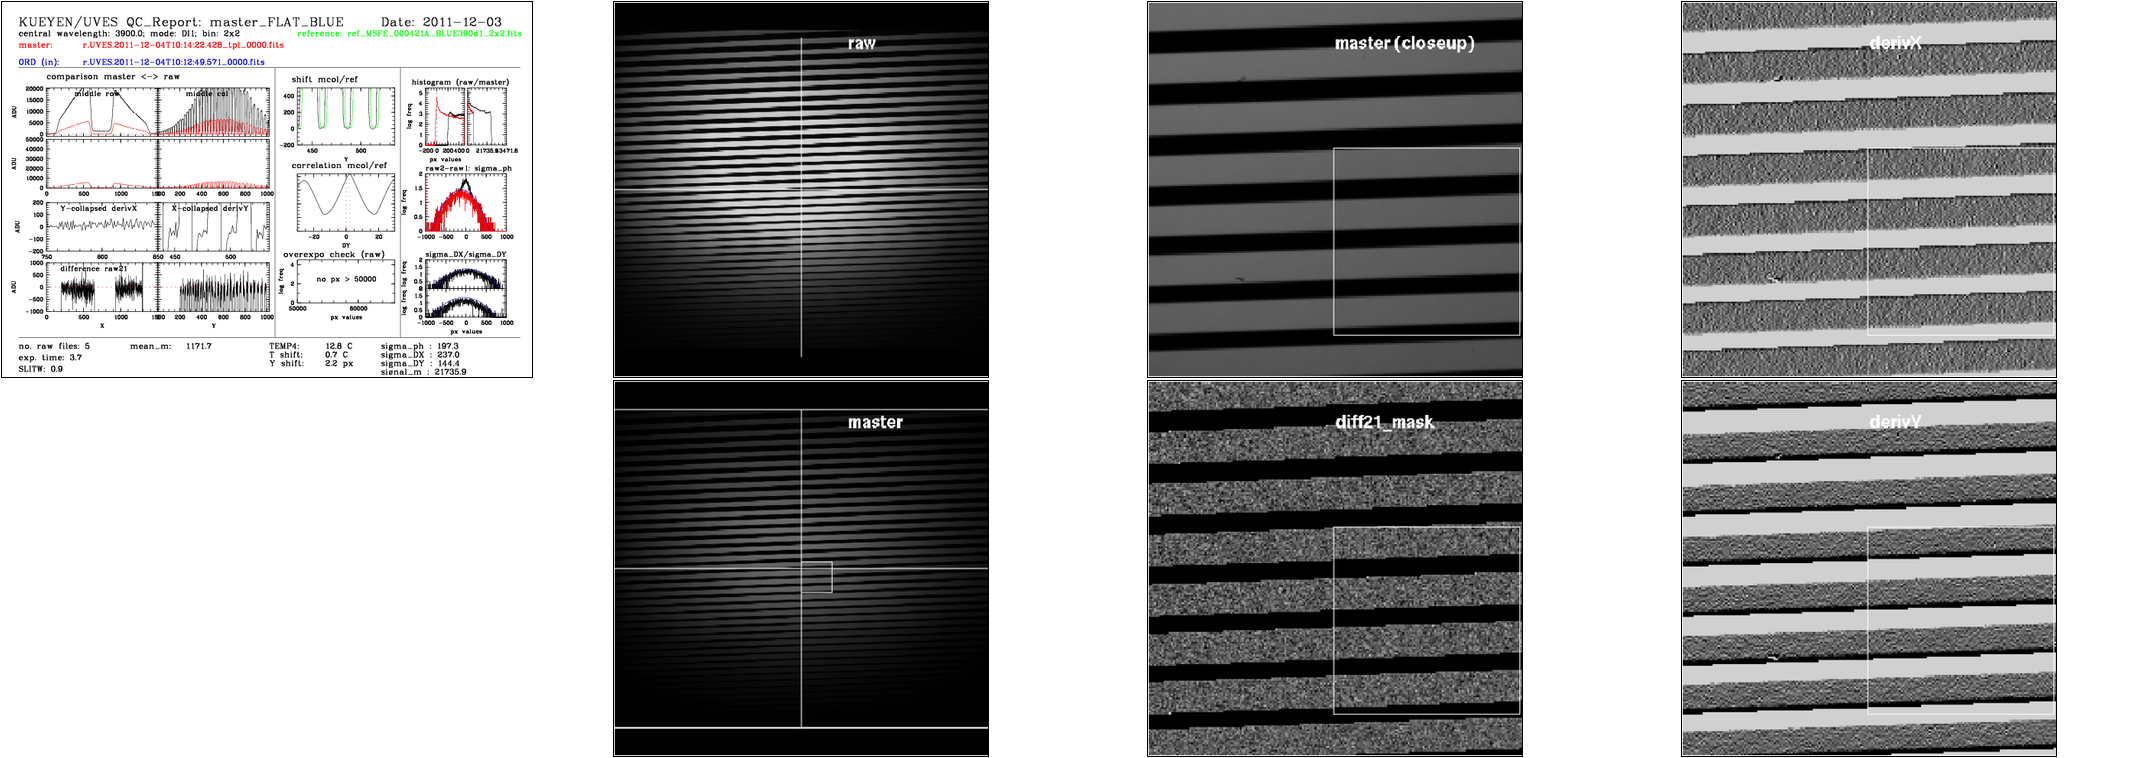
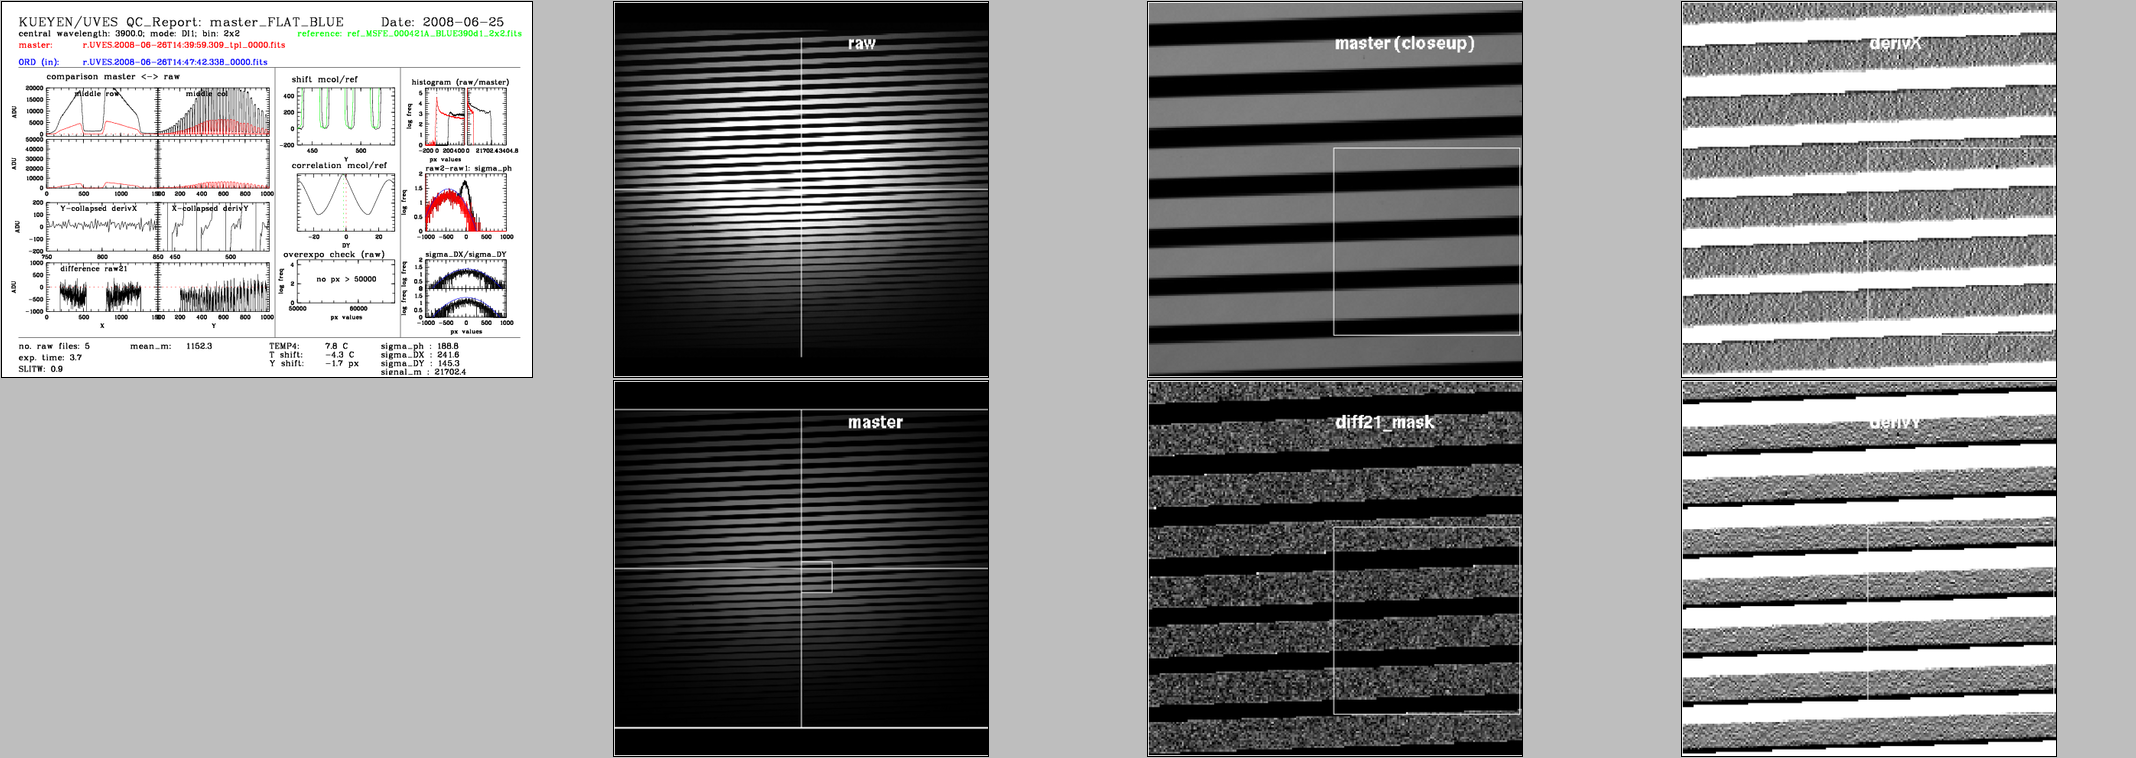
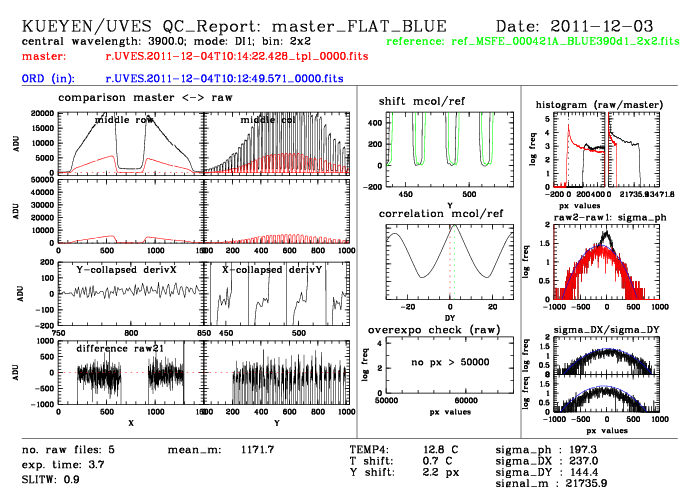
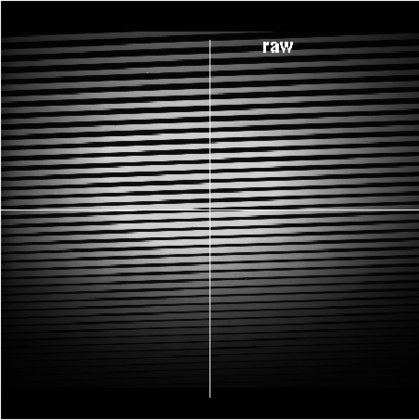
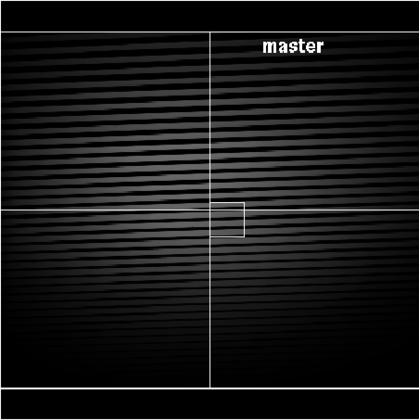
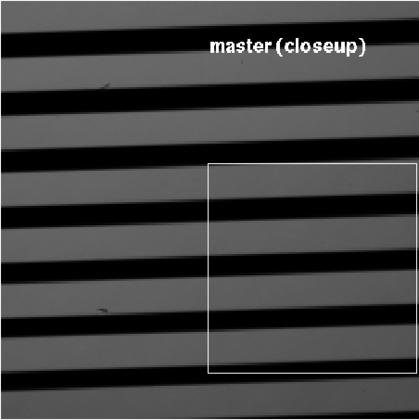
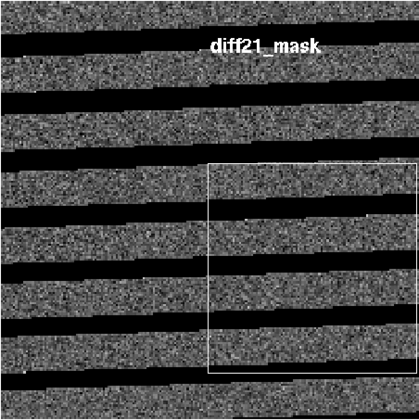
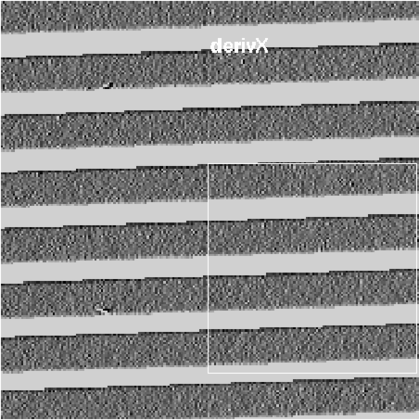
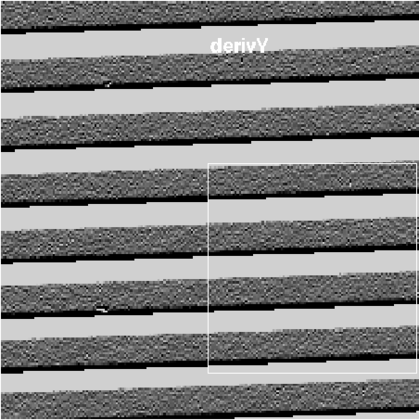
eflat_ech_blue.montage.png A montage image made up of the following individual reports simply for the purposes of easier/better display in XV during the certification process. Created together with the reference montage (see below) within the uves.MeasureQuality script. Can be recreated manually by calling the script uves.makeQCreportMontage -a <AB>, see uves.makeQCreportMontage -h for more details. A montage image made up of the following individual reports simply for the purposes of easier/better display in XV during the certification process. Created together with the reference montage (see below) within the uves.MeasureQaulity script by calling the script uves. eflat_ech_blue.montage.ref.png A montage image made up from the individual QC reports of the reference AB located by the script uves.getRefAB. During certification, the two montage images are blinked to facilitate identification of unusual features. This reference montage created at the same time as the AB montage (see above).The montage of the reference AB is easily identified during the blinking as the one with the grey background. eflat_ech_blue.montage.png A montage image made up of the following individual reports simply for the purposes of easier/better display in XV during the certification process. Created together with the reference montage (see below) within the uves.MeasureQuality script. Can be recreated manually by calling the script uves.makeQCreportMontage -a <AB>, see uves.makeQCreportMontage -h for more details. A montage image made up of the following individual reports simply for the purposes of easier/better display in XV during the certification process. Created together with the reference montage (see below) within the uves.MeasureQaulity script by calling the script uves. eflat_ech_blue.montage.ref.png A montage image made up from the individual QC reports of the reference AB located by the script uves.getRefAB. During certification, the two montage images are blinked to facilitate identification of unusual features. This reference montage created at the same time as the AB montage (see above).The montage of the reference AB is easily identified during the blinking as the one with the grey background. eflat_ech_blue_0000.fits.png box 1, left to right, top to bottom: plot 1:trace across the middle row of the RAW frame (black) and the MASTER_[E|D|T]FLAT_BLUE (red), the master flats are background subtracted and normalised to a 1sec exposure time hense the different signal level. plot 2:trace across the middle column of the RAW frame (black) and the MASTER_[E|D|T]FLAT_BLUE (red) plot 3:trace across the middle row of the MASTER_[E|D|T]FLAT_BLUE (red), as in plot 1 but at a different (not necessarily well adjusted for all MODE/WL/BINNING settings) scale plot 4:trace across the middle column of the MASTER_[E|D|T]FLAT_BLUE (red), as in plot 2 but at a different scale plot 5:Y-collapsed derivX: row averaged trace of the central region of the derivX image WITHOUT masking of the inter-order space plot 6:X-collapsed derivY: column averaged trace of the central region of the of the derivY image WITH masking of the inter-order space plot 7:difference raw21: trace across the central row (zooming on the central 100 pixels) of the diff21_mask (difference of first and second frames with inter-order space pixels 'masked to -10,000) frame plot 8: trace across the central column (zooming on the central 100 pixels) of the diff21_mask frame box 2, left to right, top to bottom: plot 9:shift mcol/ref: shift of the current master flat (black) with respect to the reference master flat (green, ref_MSFE*.fits in $DFO_CAL_DIR/refs with matching wavelength, binning and INS.PATH (BLUE, RED, DICHR#1 or DICHR#2)) plot 10:correlation mcol/ref: cross correlation function between the current master flat and the reference master flat (as above) to visualize acurrately the offset between the two. plot 11:overexpo check (raw): visual check for over exposure in the first RAW frame, histogram of pixel values. box 3, left to right, top to bottom: plot 12:histogram (raw/master): pixel value histograms of the first raw frame (black) and master flat (red), close up on low ADU values (left) and full range (right) plot 13:raw2-raw1: sigma_ph: histograms of the diff21 (black, direct difference of first and second frames) and diff21_mask (red) frames, the black "bump" above the red histogram thus represents the inter-order pixels. The overploted blue gaussian line is simply the gaussian derived from the mean and standard deviation values computed by MIDAS stat/imag command of the diff21_mask frame. plot 14:sigma_DX/sigma_DY: histograms of the derivX (top) and derivY (bottom) frames with overplotted gaussians derived from the mean and standard deviation values computed by MIDAS stat/imag command of the derivX & derivY frames. eflat_ech_blue_0000.fits_1.ima.png MIDAS display of the full RAW frame eflat_ech_blue_0000.fits_2.ima.png MIDAS display of the full master flat frame eflat_ech_blue_0000.fits_3.ima.png closeup of the central area of the master flat frame eflat_ech_blue_0000.fits_4.ima.png closeup of the same central area of the so-called diff21_mask frame. The diff21_mask frame is the difference between the first and second frames of the frame set with the inter-order space 'masked' (set to have values of -10,000) which shows in this image as the black zones. This image represents the photon noise of the RAW frames and is used for the computation of the sigma_ph QC1 parameter. eflat_ech_blue_0000.fits_5.ima.png closeup of the same central area of the so-called derivX frame. The derivX frame is computed by subtracting the first frame shifted in X by 1 pixel from itself again masking the inter-order space (this time the inter-order space end up with pixel values of +10,000 ADU and so appear in the image as white zones). This image contains structure information which is then captured in the sigma_DX QC1 parameter. eflat_ech_blue_0000.fits_6.ima.png closeup of the same central area of the so-called derivY frame. The derivY frame is computed by subtracting the first frame shifted in Y by 1 pixel from itself again masking the inter-order space (this time the inter-order space end up with pixel values of +10,000 ADU and so appear in the image as white zones). This image contains structure information which is then captured in the sigma_DY QC1 parameter. | |||||||||||||||||||||||||||
| QC1PARAM |
QC1 parameters written into QC1 table: QC1db names: ins_temp4_mean | delta_temp4 | delta_y | mean_master | signal_master | sigma_ph | sigma_dx | sigma_dy FITS key names: INS.TEMP4.MEAN | <qc_script> | <qc_script> | PRO.DATAAVG | <qc_script> | <qc_script> | <qc_script> | <qc_script> QC1 params created by pipeline: None QC1 params created by this procedure: delta_temp4 | delta_y | mean_master | signal_master | sigma_ph | sigma_dx | sigma_dy | |||||||||||||||||||||||||||
| ALGORITHM |
Description of algorithms: Algorithms for pipeline created keywords are (in principal) described in the pipeline user's manual
| |||||||||||||||||||||||||||
| CERTIF |
Reasons for rejection:
| |||||||||||||||||||||||||||
| COMMENTS | Not-infrequently the sigma_ph, sigma_DX and/or sigma_DY test statistics are, to an extent, invalidated (or at least not trivial to interpret, by unstable flux levels of the lamp, meaning that significant differences in illumination, resulting in unusual sigma_ph, sigma_DX and/or sigma_DY distributions result simply from the fact that the lamp is still warming up between the first and second frames of the set. No improvement is possible in Paranal (despite long discussions). An algorithmic improvement maybe to compare instead the last and second to last frames for these tests rather than the first and second frames. | |||||||||||||||||||||||||||
| top | [2015-10-30T08:20:56] created by qcDocu v1.1.2, a tqs tool | |||||||||||||||||||||||||||