UltraVISTA Survey Data Release 1
Provided by: Jim Dunlop
Release Date: 15/02/2012
Abstract
Overview / Layout of observations
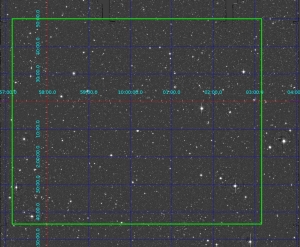
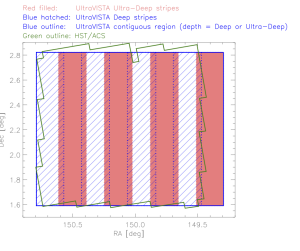
All the stacks released here cover part of the COSMOS field. Figure 1a shows the field layout on the COSMOS CFHT i-band image. The area of the green box is ~1.5 deg2. The green box corresponds to the coverage in the broad-band images (i.e. to the contiguous region); it has corners 9:57:13,02:48:00 (NW) and 10:03:00,01:37:00 (SE). Note that in the actual stacks, some data is missing in the bottom south-east corner due a bad detector on VIRCAM. Figure 1b shows schematically the deep and ultra-deep components of the UltraVISTA survey, in addition to the area covered by ACS/HST. Figure 1c shows the 5 images.
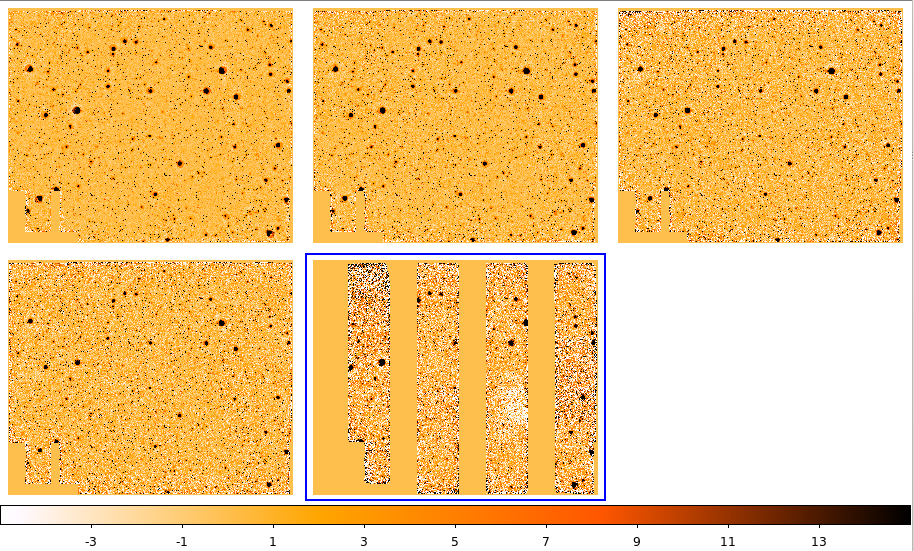 Figure 1c. The 5 stacks, top: Y, J, H; bottom: Ks, NB118. The images have been displayed using intensity cuts -5,15 "ADU" (cf. the colour bar), with the "ADU" in these images corresponding to a zero point of 30.0 in AB magitude. North is up and east is to the left, and the layout corresponds to Fig. 1b.
Release Content
| Zero point |
Pixel scale |
Tangent point |
|---|---|---|
| (AB/sec) |
(arcseconds/pixel) |
(decimal degrees) |
| 30.0 |
0.15"/pixel |
150.116, 2.2000 |
| Filename | Filter | Av. Exposure per. pixel | Mean FWHM (" +/- 0.1") | 5-sigma 2" ap. (AB MAG; +/- 0.1 mag) | 95% completeness |
|---|---|---|---|---|---|
| UVISTA_Y_27_04_11_skysub_015_v1.fits | Y | 42360 | 0.82 | 24.6 | 24.2 |
| UVISTA_J_03_04_11_skysub_015_v1.fits | J | 49720 | 0.79 | 24.7 | 24.2 |
| UVISTA_H_26_04_11_skysub_015_v1.fits | H | 42520 | 0.76 | 23.9 | 24.1 |
| UVISTA_Ks_15_12_10_skysub_015_v1.fits | K | 39400 | 0.75 | 23.7 | 23.8 |
| UVISTA_NB118_20_08_11_skysub_015_v1a.fits | NB118 | 23773 | 0.75 | 22.9+/-0.2 | TBD |
The limiting magnitude for each filter is computed using the 5-sigma standard deviation in 2" diameter apertures scattered randomly over the field. The completeness measurements are computed as the magnitude at which 95% of random stellar sources injected into the real field can be successfully recovered.
Note that the large size of these images means than to display or manipulate them may require a machine with a 64bit architecture and sufficient memory (nominally 8Gb).
Release Notes
Input images and image selection
The images in this release were taken between 5th December 2009 and the 19th of April 2010. This does not consist of the complete number of images taken for the UltraVISTA program in the 2009-2010 observing season; subsequently, around 10% additional images in H and Ks were made available by CASU using a different pipeline processing, after we had already graded the first batch of images. In order to maintain as a homogenous as possible data set, we restrict in this current release ourselves to this initial batch. However, had we included these data, the average exposure time per pixel would have been 4800 s and 5400 s higher in H and Ks respectively, i.e. around 10%.
The images considered here were all processed used v0.8 of the CASU release. In total, we consider 7031 individual images (each of which is a single multi-extension fits image containing 16 image extensions for each of the VISTA detectors). We do not use the confidence maps provided by CASU, but create our own weight-maps from the supplied flat-fields and bad pixel maps.
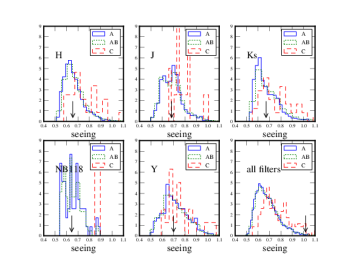
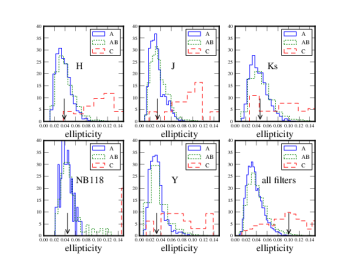
These images were inspected and graded in the YOUPI environment at the TERAPIX data processing centre at the IAP, Paris. Images were assigned a grade of A, B (usable for science), C, D (rejected). Figure 2 and 3 show the five-filter seeing and ellipticity distributions for all images considered for this release, divided by image classification. Note that the distribution for each object class has been rescaled accordingly.
Based on these distributions we decided to keep all images which have stellar 1.0" and ellipticity <0.1 and which were classified A, B based on visual inspection. The visual inspection process in general finds images which have bad PSFs or other optical defects which would have not been found by a typical seeing or ellipticity cut (for example, tracking problems which produce double-lobed PSFs). In total we reject 426 images or around 6% of the total.
Outline of image processing
We adopted the same set of processing steps for each of the five filters. After image selection, we processed the CASU sky-subtracted images (by which we mean astrometric solution, weight map generation, and stacking) to make a ``first-pass'' stack to derive the object mask for each image. For these images we used the TERAPIX QualityFITS tool to create weight-maps from the corresponding flat-fields supplied in the release and image catalogues. Using scamp we computed astrometric and photometric solutions using as reference catalogue the COSMOS i-band astrometric reference catalogue, described in Capak et al. 2007.
To create our sky-subtracted images, we use a set of tools developed at TERAPIX. To summarise, we start by ``adding back'' to each image the sky background frames subtracted by CASU, supplied as part of the original data release. Based on the first pass-stack and astrometric solutions, we compute object masks for each individual image. Next, we use these object masks (appropriately warped to match the images to compute and subtract a running sky for each individual image, based on a median of images taken during a 20 minute timescale. After the subtraction of the running sky, we re-''destripe'' the images and remove large-scale background gradients using sextractor. In the final step weight maps and catalogues are created for each image. Saturated objects, based on an examination of the stellar locii, are flagged in the input catalogues. These catalogues are used to compute the final astrometric and photometric solutions. Note that we use the photometric solutions supplied by CASU for their .st stacks as initial approximate photometric solutions for our individual images. All these images are marked as ``photometric'' , although re-scalings are allowed based on overlapping images.
In the last step, the images are coadded using a modified version of the software which permits combination of images based on a clipped sigma estimator; we use a clipping threshold of 2.8 sigma. Bad regions on individual detectors, such as half of detector 16, are also masked, which explains the irregular appearance in the SE corner of the stacked images (cf. Fig. 1c).
Given the dense sampling for the astrometric reference catalogue, and the large amount of overlap between exposures, our astrometric accuracy is excellent, with r.m.s values much smaller than one pixel, typically ~0.1" compared to the external catalogue and ~0.05" internally.
Stacked data products
In this release Y,J,H, K and NB118 stacked images and their corresponding weight maps for data taken during the first year of public survey operations of the UltraVISTA survey are made available. The images have a zero point of 30.0AB magnitudes and a pixel scale of 0.15"/pixel. The CASU VEGA magnitudes are converted to the AB system by applying the offsets detailed in Table 2 below. These offsets were calculated from the VISTA filter curves and detector efficiency curves. The images all have a common tangent point, in decimal RA,DEC of (150.116, 2.2000), corresponding to the tangent point of the publicly available IRSA/COSMOS images. The uncompressed image is ~9Gb and has a size of 48096x48096 pixels (note that the large amount of blank pixels in these images is primarily so they correspond to publicly-available COSMOS data).
| Filter | Correction to AB (AB=Vega+x) |
|---|---|
| Y | +0.61 |
| J | +0.92 |
| H | +1.38 |
| Ks | +1.84 |
| NB118 | +0.85 |
Catalogues
Two sets of catalogues are supplied: source lists extracted on single images, and "dual-mode" catalogues where the Ks band is used as a detection image. These catalogues, since they share the same detection list, can be used to easily measure colours for each object. These catalogues are meant as preliminary catalogues and have not yet been validated extensively, and should be used with caution. No masks have been applied; the catalogues contain all objects to the specified detection threshold. Aperture magnitudes reported in the catalogues are measured in 2" and 7" diameters respectively.
Quality assessment
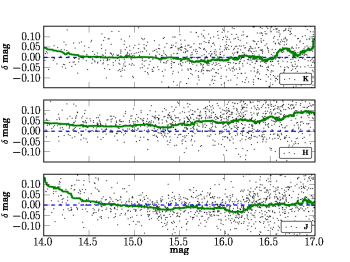
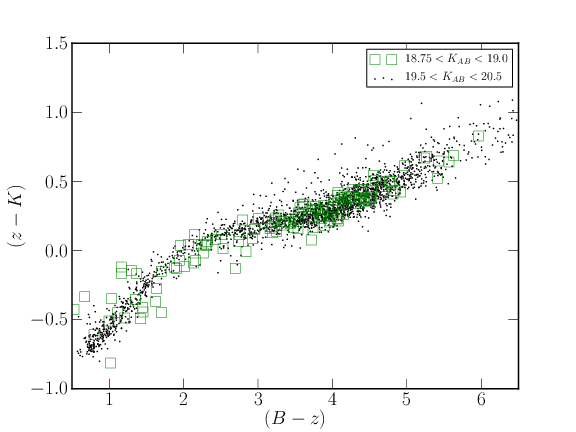
We have carried out an extensive set of quality assessment tests on the full mosaics. In addition we have computed the colour-colour diagrams of faint and bright stars. These tests are explained in detail in the accompanying data paper. Figure 4. shows the comparison of 2MASS magnitudes with UltraVISTA magnitudes. In the zone where 2MASS and UltraVISTA magnitudes are both reliable, both catalogues agree well, to within 0.05 magnitudes.
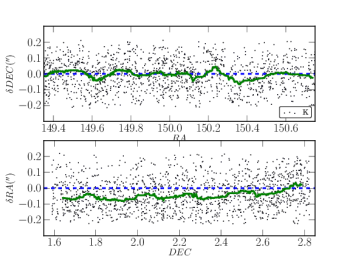
In Figure 5. we compare the positions of sources in our K-band stack with 2MASS stars. The origin of slight offset in RA we observe is because we use the COSMOS astrometric reference catalogue which is not tied to 2MASS. Comparisons with HST-ACS data (detailed in the accompanying data paper) show no offsets.
Data Format
| Stacked science images | Weight map |
|---|---|
| UVISTA_Y_27_04_11_skysub_015_v1.fits | UVISTA_Y_27_04_11_skysub_015_v1.weight.fits |
| UVISTA_J_03_04_11_skysub_015_v1.fits | UVISTA_J_03_04_11_skysub_015_v1.weight.fits |
| UVISTA_H_26_04_11_skysub_015_v1.fits | UVISTA_H_26_04_11_skysub_015_v1.weight.fits |
| UVISTA_Ks_15_12_10_skysub_015_v1.fits | UVISTA_Ks_15_12_10_skysub_015_v1.weight.fits |
| UVISTA_NB118_20_08_11_skysub_015_v1a.fits | UVISTA_NB118_20_08_11_skysub_015_v1a.weight.fits |
| Single-band catalogues | Multi-colour catalogues(detection on Ks image) |
|---|---|
| UVISTA_Y_27_04_11_skysub_015_v1_cat.fits | UVISTA_Ks_15_12_10_skysub_015_v1_Y_cat.fits |
| UVISTA_J_03_04_11_skysub_015_v1_cat.fits | UVISTA_Ks_15_12_10_skysub_015_v1_J_cat.fits |
| UVISTA_H_26_04_11_skysub_015_v1_cat.fits | UVISTA_Ks_15_12_10_skysub_015_v1_H_cat.fits |
| UVISTA_Ks_15_12_10_skysub_015_v1_cat.fits | N/A |
| UVISTA_NB118_20_08_11_skysub_015_v1a_cat.fits | UVISTA_Ks_15_12_10_skysub_015_v1_NB118_cat.fits |
Note that filenames provided by the ESO archive are different than the filenames here; these filenames are given by the ORIGFILE header keyword. This script will rename the ESO images to match the UltraVISTA naming convention.
Data retrieval
Go to the data products query form to find and retrieve the data from the ESO Science Archive. Just press the Search button to find all data belonging to this release, or specify search constraints to find a subset thereof.
Acknowledgements
Users of this release should cite "McCracken et al. 2012 (in prep.)"; a draft of this paper is available from the ultravista release site ultravista.org/release1/. The data source should be acknowledged as follows:
Based on data products from observations made with ESO Telescopes at the La Silla Paranal Observatory under ESO programme ID 179.A-2005 and on data products produced by TERAPIX and the Cambridge Astronomy Survey Unit on behalf of the UltraVISTA consortium.

