HARPS Daily LN2 Consumption and VV Pressure Change Monitoring
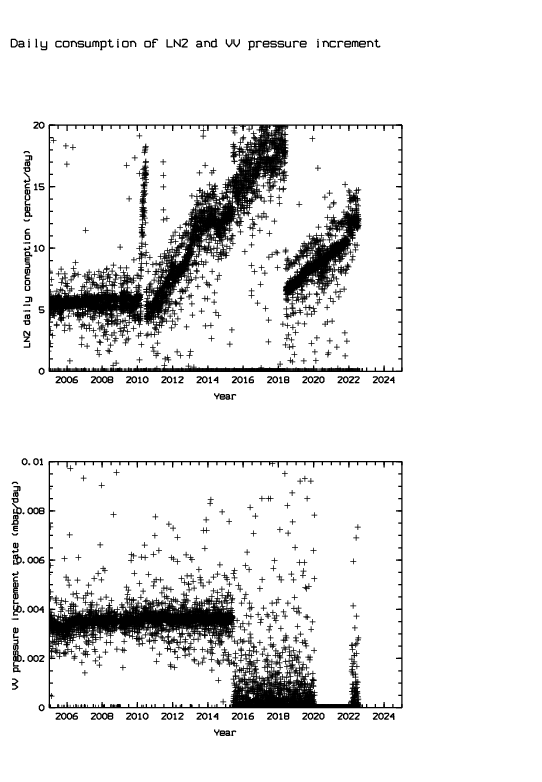
Daily LN2 consumption and VV pressure change monitoring
Following is the plot of the time evolution of the liquid N2 consumption and the change rate of the vacuum vessel pressure.
These data are extracted from the output of the levels monitoring of pressure and liquid N2, done every day from 12 hrs UT on intervals of one minute, during 24 hours.

