HARPS: flat field monitoring page
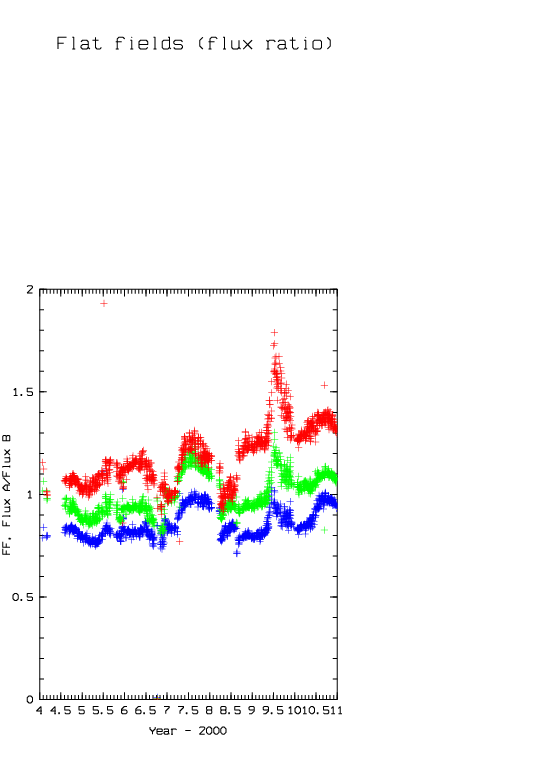
Following is the plot of the time evolution of the ratio of the intensity measured from both fibers on a flat field exposure for three different orders. The orders are: 161 (380nm), 114 (534nm), 89 (688nm). Ideally all ratios would be 1. The same lamp is illuminating both fibers.
These data are extracted from the output of the pipeline processed afternoon calibrations, according to the HARPS calibration plan.
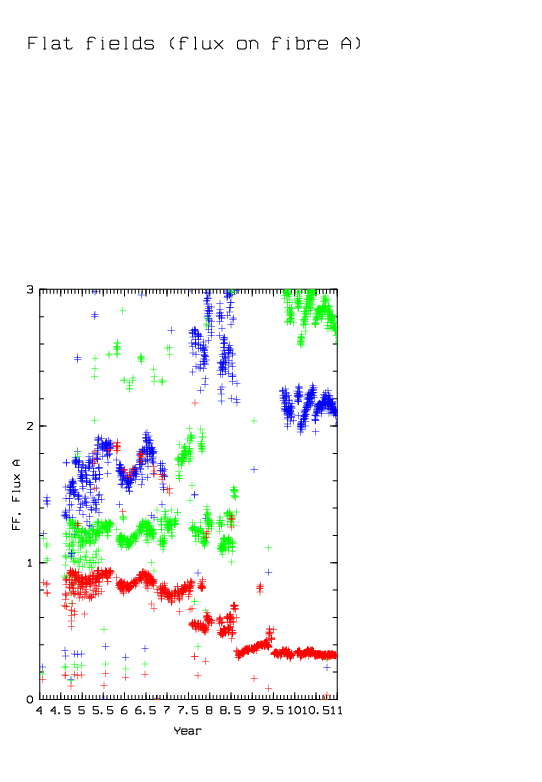
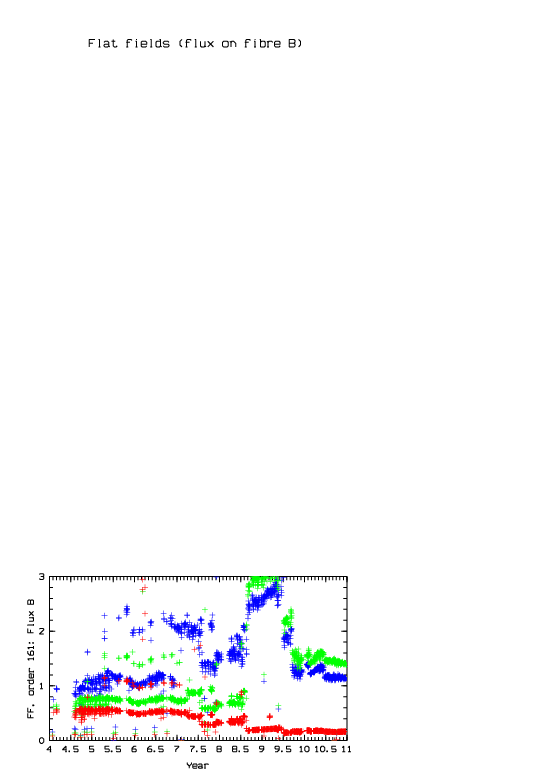
The flux on each individual fibre is also plotted.


