Characterization of the HARPS iodine cells
INTERNAL MEMORANDUM
| Subject: |
Characterization of the HARPS iodine cells. |
| From: | Gaspare Lo Curto |
| To: |
Ueli Weilenmann, Alain Gilliotte, Wolfgang Eckert, Emilio Barrios, Andres Gonzales, Gorky Roman, Olivier Hainaut, Thomas Dall, Gero Rupprecht, Francesco Paresce (ESO), |
| CC: | Jorge Melnick, Guy Monnet. |
| Memo: |
LSO-MEM-ESO-900200-0001 |
| Date: |
December 28, 2003 |
Summary
This memorandum presents a preliminary characterization and summarizes the status of the HARPS iodine cells. They were filled by Physikalisch-Technische Bundesanstalt, Braunschweig, Germany (PTB), supplied with heating elements and insulation and tested in La Silla and three of the (up to date) were calibrated in Kitt Peak at the Fourier Transform Spectrograph (FTS) of the National Solar Observatory (NSO) on December 16 and 17 2002.
The cells will be named with numbers runing from 1 to 5, the number referring to the order of their production. There is a fundamental difference in the filling method of cell # 1 with respect to the other two. The amount of iodine inserted in cell # 1 was such to provide the proper line depth, but it would not evaporate completely, even at a high temperature of the cell (100°C). An increase in temperature would therefore evaporate more iodine, making the temperature stability of cell # 1 unsatisfactory. All the other cells instead were filled with just enough iodine that should completely evaporate at 60°C. The amount of iodine is smaller, reflecting itself in a smaller line depth, but the temperature stability is satisfactory.
During the tests of the first three cells performed in La Silla all measurements were conducted using the CES spectrograph at a resolving power of R= 220,000. Analysis was made on the Gaussian convoluted images, with a final resolving power of 100,000, closer to the final HARPS resolving power. An effort was made to maximize similarities with the tests conducted by Martin Kuerster on iodine cell # 1 on February 14 2002.
The HARPS cell # 1 has low transmission, unsatisfactory temperature stability and line depth within the tolerance of the requirements. It could be used successfully in a temperature controlled environment.
The HARPS cells # 2, # 3 and # 5 have satisfactory temperature stability, good transmission, but iodine absorption line depths fall slightly short of expectations.
The following list of requirements and some general comments are copied directly from Martin Kuerster memo .
Requirements given to manufacturer
The cuvettes of the HARPS iodine cells were produced by HELLMA, Muellheim/Baden, Germany, and filled with iodine by PTB. The following requirements are of concern to us
Requirement 1
Properties of the iodine spectrum: Iodine line depth and transmission through the iodine cell as measured at a resolving power of R = 100000 as a function of wavelength when the iodine temperature is stable at 70 degrees Celsius:
| Wavelength (nm) | 500 | 510 | 530 | 560 | 600 | 630 | 650 | 660 |
| Line depth (%) | ||||||||
| strongest line | 23 | 63 | 85 | 71 | 51 | 29 | 9 | 6 |
| average line | 12 | 32 | 43 | 36 | 26 | 15 | 5 | 3 |
| Transmission (%) | ||||||||
| in quasi continuum | 18 | 41 | 62 | 71 | 72 | 70 | 70 | 70 |
| total | 15 | 28 | 41 | 49 | 62 | 69 | 70 | 70 |
Note: these values have a tolerance of about 10%.
Requirement 2
Around the operating temperature the change of the iodine cell line depth should be < 0.2% per degree over the wavelegth range 5000 - 6000 A.
As PTB could not provide us in advance with clear characteristics of the iodine cells (whose physical dimensions are tailored for the HARPS Cassegrain fiber adapter and non standard for them), measurements of the UVES cell were used as a reference to establish these requirements; it was decided that PTB would send us one cell after filling and await our feedback before proceeding with filling of the next. Eventually the best quality cell will be selected for use in the HARPS Cassegrain fiber adapter.
Temperature control
The cell temperature is measured by a thermistor inserted outside the cell, along the circumference of the cell cylindrical body, close but not in contact with the heating elements. A PLC controls the heating, achieving a temperature stability better than 0.4 °C peak to peak. The long filling tube (~4cm) or neck of the cells is heated in such a way to avoid I2 trapping along its length. The colder part of the cells is the center of the windows, which is the part in contact with the external environment and farther away from any heating element. When turning off the heating elements of the cells, I2 condensation always happens on the center of the window, confirming that this is the coldest point in the system.
Ideally the control thermistor should be located in the coldest point of the system, to insure that the temperature is always above a certain limit for the whole system. This is clearly not practical in our case as the coldest point is along the optical path, which we do not want to obstruct.
At room temperature (20°C), a measured temperature of 100°C on the thermistor corresponds to a temperature of 82°C on the side of the cell's window; the center of the window is about 6°C cooler. In a 1°C environment the temperature on the side of the cell window is 77°C when the programmed temperature is 100°C. Tests were also performed in a -15°C environment, resulting in the temperature window's dropping by 4°C with respect to the 1°C environment. However, historically, observations at temperatures much below zero are unlikely, as a cold front generally brings clouds and snow, and the telescope dome is anyway closed.
Althought these measurements were instructive, it was later demonstrated that the flow of air along the cell has a larger effect on its temperature stability than the ambient temperature itself.
The recommended operation temperature is 140°C at the thermistor, as a compromise between insuring complete sublimation of the iodine at every realistic temperature of operation and minimizing the amount of heat sources in the HARPS adapter.
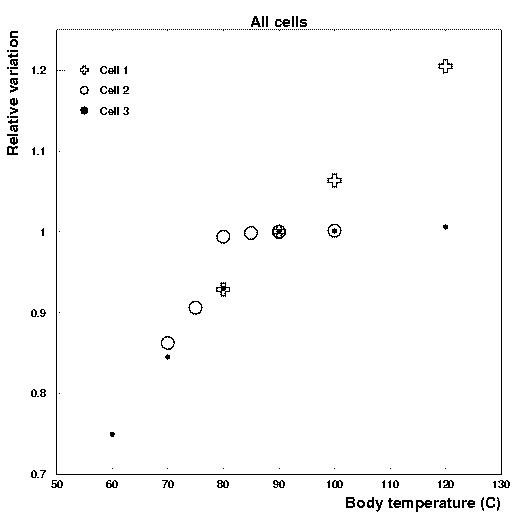
A plot of the line depth as a function of temperature as measured by the control thermistor located on the outside of the cylindrical body of the cell, is shown in figure 1.
 Figure 1.
Measurements
The CES spectrograph was used at a resolving power of R = 220,000 together with its white light flat field lamp to obtain iodine absorption spectra for the characterization of the HARPS iodine cells. The spectra obtained were convolved with a Gaussian to obtain a final resolving power of R = 100,000, i.e. the value for which the requirements had been established, based on the comparison with data of the UVES iodine cell taken at R = 100,000. The resolving power obtained after the convolution is also closer to the resolving power for which HARPS has been designed (R = 90,000).
Iodine transmission and absorption line depths are measured at several temperatures: 150°C, 140°C, 130°C, 120°C, 100°C, 90°C, 80°C, 70°C and 60°C. The cells were first stabilized at the topmost temperature for two hours (temperature variation after stabilization is within ± 0.2° C peak to peak). Successive changes at lower temperatures were made giving at least a one hour time to the cell to equilibrate. Cell-out flats were taken for reference.
At this moment, line depth and transmission are measured only for the 539.5 ± 1.8 nm wavelength for cells # 1, 2 and 3, this being the representative wavelength for the region with the strongest iodine lines (and extensively used at CES).
When calculating the relative line strength and the transmission, the 7% stray light in the instrument has been taken into account and subtracted.
Results
Wavelength = 539.5 nm.
| Cell | cell # 1 | cell # 2 | cell # 3 |
| Line depth at 100° C (%) | |||
| - strongest line | 80.88 | 73.9 | 76.74 |
| - average line | 48.0 | 44.1 | 43.0 |
| Transmission at 100° C (%) | |||
| - in quasi continuum | 50.8 | 60.0 | 58.5 |
| - total | 33.6 | 43.4 | 42.0 |
| Temperature stability at 100° C (%) | |||
| - line strength change per degree (relative to quasi-continuum) | 0.907 | 0.032 | 0.025 |
Measurement's errors are estimated to be of the order of 10%. Similarly to Martin Kuerster's memo the line change strength was measured on the strongest line of the absorption spectrum. From figure 1 it is clear that iodine sublimes completely at a lower temperature in cell # 2 than in cell # 3. Cell # 1 never reaches complete sublimation of the iodine crystals.
Calibration
Cells # 1, 2 and 3 were calibrated at the Fourier Transform Spectrograph (FTS) at the U.S.A. National Solar Observatory (NSO) in Kitt Peak, Arizona. A calibration run was allocated on December 16th and 17th 2002. Alain Gilliotte performed the measurements assisted by the FTS support team. All measurements were performed with a dispersion of 0.007 cm-1 and a resolving power in the range 700,000<R< 1,000,000 depending on the wavelength. The wavelength range from 500nm to 710nm was covered; at the extremes of this range the iodine lines are negligible. The pre-reduced (bias subtracted, wavelength calibrated) data are written on CD. An instrument scan is also included in the data. The following table shows the measurement, the number of scans and the temperature at which the scan was carried over. The signal to noise at the peak of the interferogram is approximately 900 for 10 scans.
| Scan | Temperature | # of scans |
| Reference (no cell) | --- | 85 |
| Cell # 1 | 110°C | 10 |
| Cell # 2 | 110°C | 10 |
| Cell # 2 | 100°C | 40 |
| Cell # 2 | 90°C | 10 |
| Cell # 3 | 110°C | 10 |
| Cell # 3 | 100°C | 10 |
| Cell # 3 | 90°C | 10 |
Cell number 1 was tested only at 110°C because this is its most likely temperature of use (less iodine crystals) and because we needed more time in order to improve the signal to noise of the measurement on iodine cell # 2 at 100°C (our best cell at the recommended temperature of use). This was made necessary as the time that was allocated to us was insufficient to achieve the signal to noise we requested (>2000).
A similar mission is foreseen to calibrate cell # 5.
New cells: cell# 4 and cell# 5
During the first commissioning of HARPS (February 11-27 2003) the cell # 2 was found broken. We were therefore left with only one operating cell: # 3. Cell # 1, which performed an unsatisfactory temperature stability is provisionally used in the calibration unit, where temperature should be stable at 16.0± 0.5C.
Two new cells were bought as spares afterwards, hereafter named cell # 4 and cell # 5. These cells were tested directly into the HARPS adapter, rather than using the CES spectrograph. This, apart from permitting to test the cells on the final configuration, allowed to record at once all the I2 relevant spectral range, a much more complete information obtained much more rapidly than it would have been possible with CES.
Cell # 4 was damaged while heating up in the HARPS adapter. The iodine escaped and one internal insulation layer was found burned.
Cell # 5 performed according to specifications, and its characteristics are very similar to cell # 3.
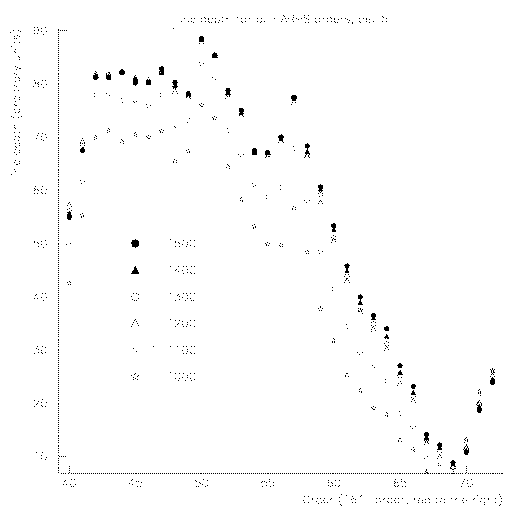
Maximum line depth for each order is displayed in Figure 2. Data points for temperatures from 150C to 120C superimpose at almost every wavelength.
 Figure 2.
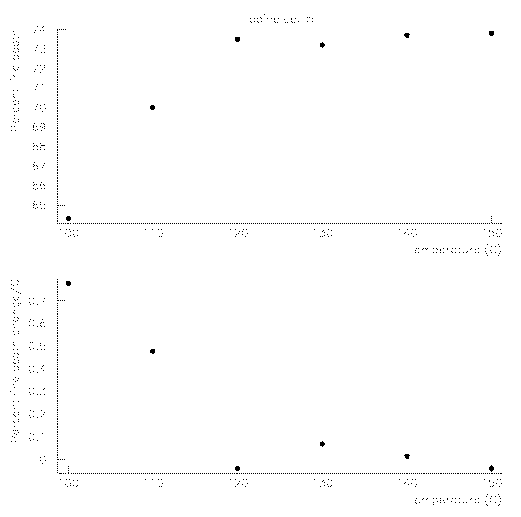
In figure 3, top panel, is shown the relative line depth of the strongest I2 line as a function of the cell's temperature. It is clear that iodine is saturated above 120C.
 Figure 3.
In the bottom panel of figure 3, is plotted the relative line depth change per degree Celsius as a function of the temperature. The cell statifies the stability requirement (relative line change < 0.2% per degree Celsius) from a temperature of 120C onwards.
To assess the difference between cell # 3 and cell # 5 has to be taken into account that the quoted measurements of cell # 3 were conducted in the CES spectrograph, at a constant temperature of 16± 0.5C while the measurements of cell # 5 were carried over in the HARPS adapter, at an ambient temperature below 10C and in presence of the cold air flow generated by the primary mirror ventilators of the 3.6m telescope.
During the commissioning of the HARPS iodine cell mode (August 1-8 2003, ambient temperature <2C at night) it was demonstrated that the line depth of cell # 3 stabilizes for temperature of the cell of 140C in operating conditions (cold winter night, dome open, mirror ventilators on). This is therefore the recommended temperature of operation for both cells.
Future plans
The spare cell # 5 should be calibrated using the FTS spectrograph at the latest during the month of January 2004.
Operating temperature
The requirements about the operating temperature are
a) keep the cell temperature to a minimum in order to avoid degrading the seeing
and inducing thermal stresses to components in the HARPS adapter;
b) rise the temperature to a level in which the iodine in the cell is completely
sublimated for any realistic operation condition.
Taking into account these requirements and the eperience gained with the system we recommend a temperature of use of the cells of 140C, corresponding to a temperature of at least 76°C on the center of the window's cell when the environment is at 0°C and the telescope in standard operation. This would guarantee that all iodine is completely saturated even at the lowest temperatures of operation that are realistically met in La Silla.
Conclusions
For the wavelength range 539.5± 1.8nm line depth and transmission were measured from 60°C to 120°C for the HARPS iodine cells 1, 2 and 3.
Temperature stability of cell # 1 is unsatisfactory, while line depth is within the tolerance of the requirements. Transmission is lower than expected. Cell # 2 and cell # 3 achieve the requested temperature stability and transmission. Line depth (strongest line) is smaller than requirements, but this will not jeopardize the project.
Iodine in cell # 2 was sublimating completely at a lower temperature than in cell # 3. However, given that cell # 2 was broken, cell # 3 will be used in the HARPS adapter instead. Cell # 1 could be used in the HARPS calibration unit, as this would be a temperature controlled environment (within 0.1°C) and temperature stability would not be an issue.
Cell # 4 was broken while under test, and cell # 5 was found satisfactory, its quality being identical to that of cell # 3.
The recommended temperature of use of cell # 3 and cell # 5 is 140°C as measured by the installed thermistor.
FTS scans
The 2002 FTS scans can be found in the following directory .
The files are in fits format, and the wavelngth is expressed in cm^-1.
