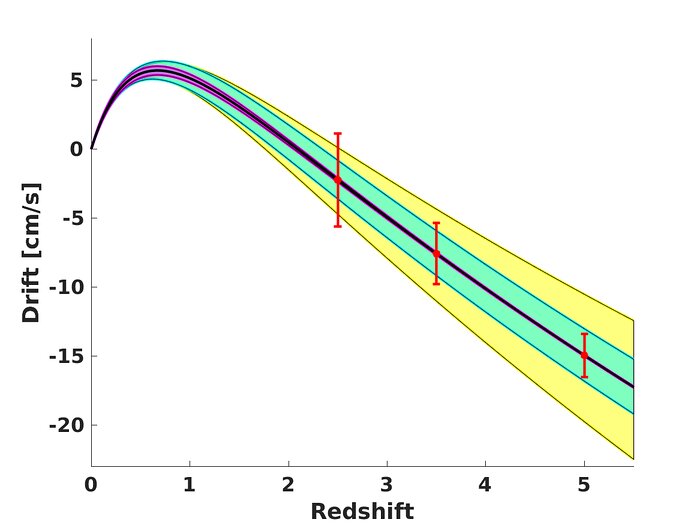
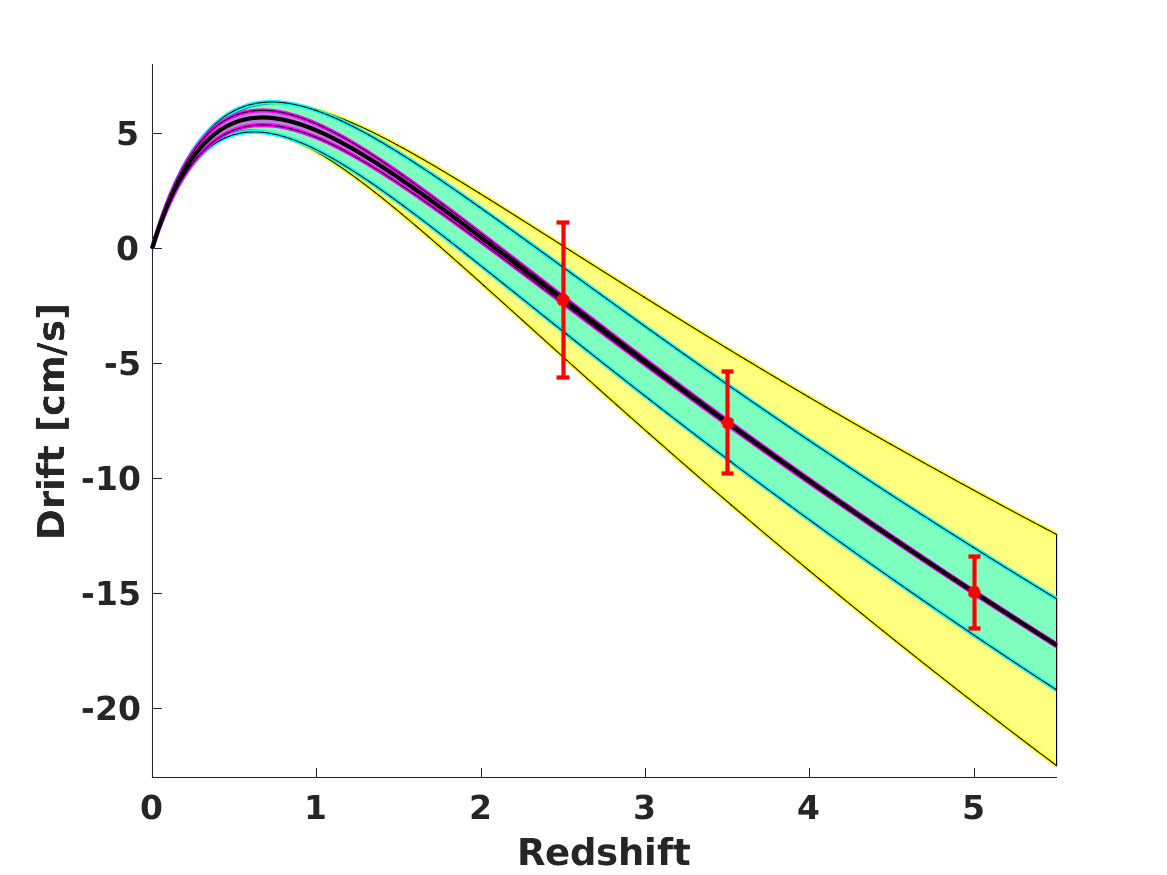
Illustrating the constraining power of redshift drift measurements by the ELT for various cosmological models
The black line depicts the drift signal for an experiment duration of 20 years in the current (2019) best-fit flat LambdaCDM model, and the red points simulate the error bars for 3 such ELT measurements. The coloured bands represent the regions allowed by the present data at 1 sigma, when a single parameter is changed with respect to the best-fit model: flat LambdaCDM with a different matter density in cyan, a model with a constant dark energy equation of state in magenta, and a modified gravity model studied in Faria et al. 2019 in yellow.
Credit:Carlos Martins
About the Image
| Id: | constrainig-power-redshiftdrift |
| Type: | Simulation |
| Release date: | 18 September 2020, 09:46 |
| Size: | 1167 x 875 px |
About the Object
| Type: | Unspecified |
| Category: | ELT Illustrations |