Full sky map of bright quasars
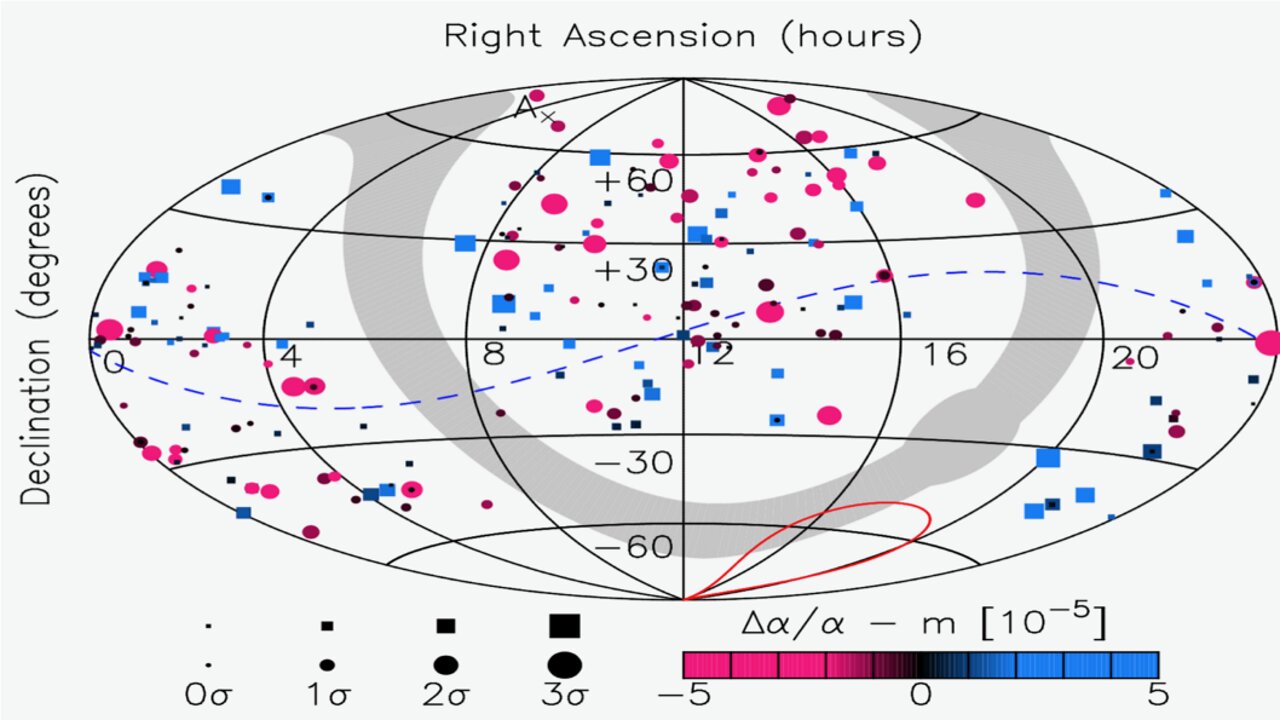
Full sky map of all measurements of the fine-structure constant along the line of sight of bright quasars, in early 2019. Overall there is a 3.5 sigma statistical preference for a dipolar spatial variation. The preferred direction of maximal variation is inside the solid red line, and the dashed blue line depicts the equator of the dipole.
Credit:Mike Wilczynska and John K. Webb
About the Image
| Id: | full-sky-map-bright-quasars |
| Type: | Chart |
| Release date: | 30 September 2020, 13:53 |
| Size: | 1058 x 595 px |
About the Object
| Type: | Local Universe : Galaxy : Activity : AGN : Quasar Early Universe : Galaxy : Activity : AGN : Quasar |
| Category: | Illustrations |