Spectroscopy
If signs of life on another planet are ever discovered, they will be found with a spectrograph
Spectroscopy is one of an astronomer’s favourite tools to help understand the Universe. Planets, stars and galaxies are just too far away to be analysed in a laboratory. Fortunately, very important information about these distant bodies is written in the light we detect with a telescope.
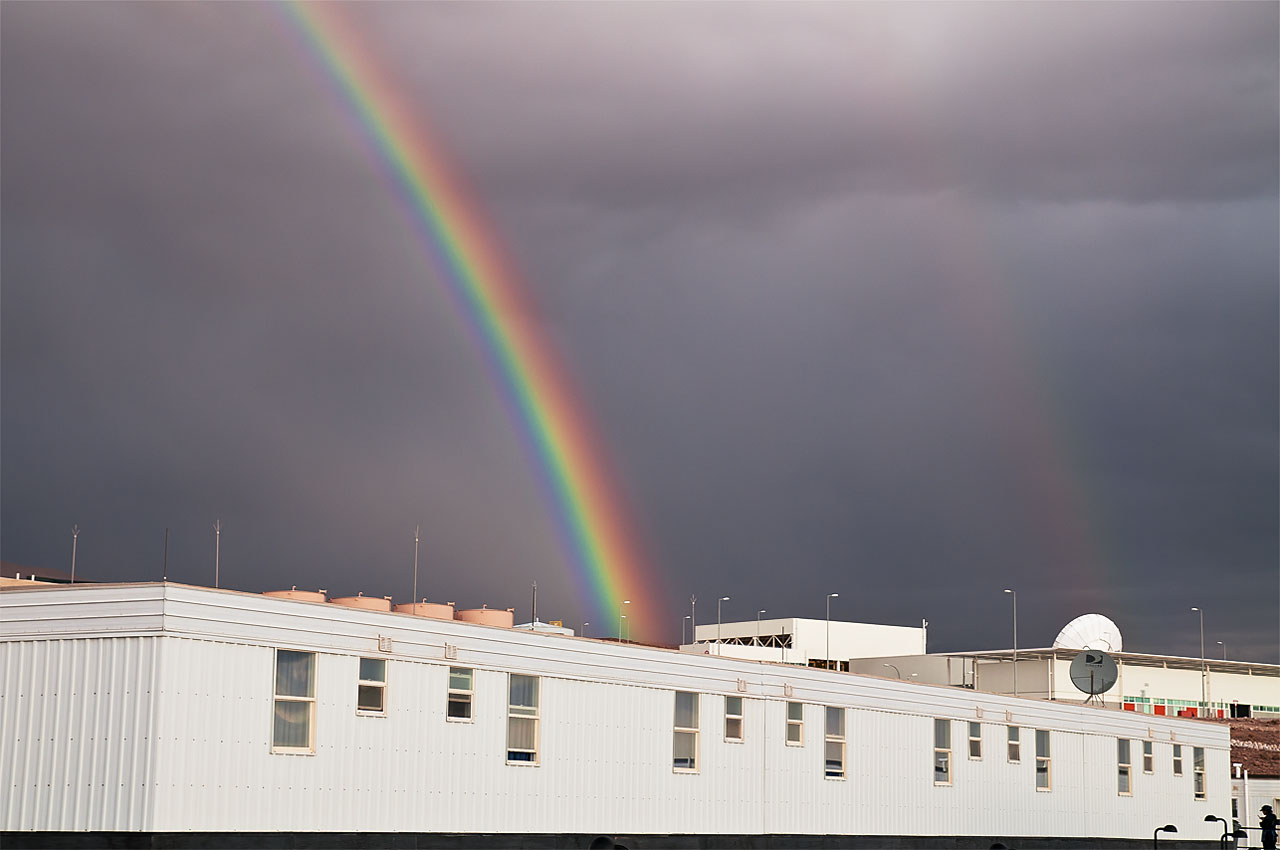
But the light is not an open book. To be read, light must be split into its different colours (or wavelengths), in the same way that rain droplets disperse the light to form a rainbow. Newton called this rainbow of colours a spectrum, the Latin word for “appearance”.
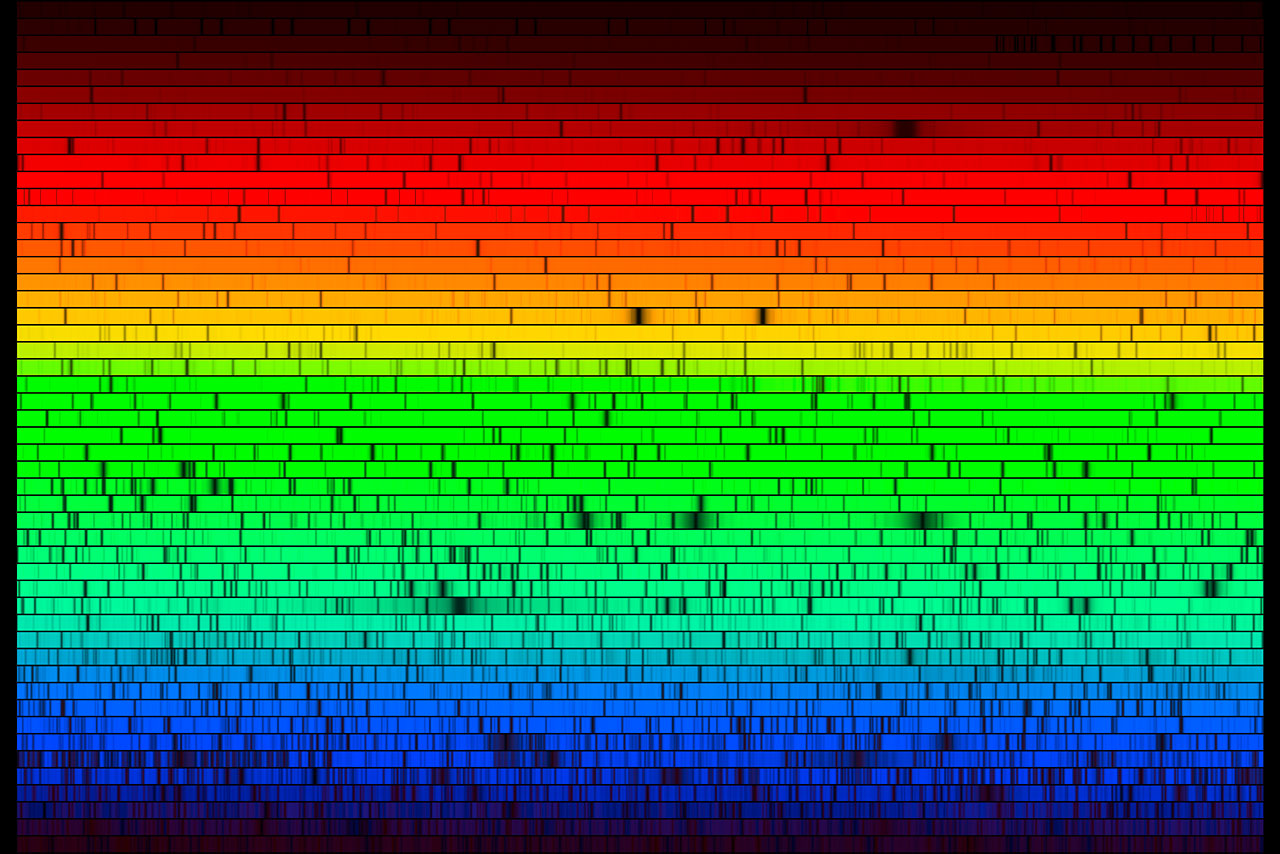
The first astronomical application of spectroscopy was in the analysis of sunlight by Fraunhofer and Kirchhoff, in the early 19th century. It was expected that the white light emitted from the Sun would produce a clean rainbow when passing through a prism. But, for the very first time, a pattern of dark lines was also noticed. These unexpected lines were the “fingerprints” imprinted in the light by the different chemical elements interacting with it and are called absorption lines.
The beauty of this interaction is that each chemical element or molecule produces a unique signature in the spectrum, a sort of barcode that unequivocally identifies one element from another. By decoding these barcodes, spectroscopy can reveal important properties of any body which emits or absorbs light.

The barcode of the Sun. A very long spectrum was chopped in small chunks and then displayed one on top of another.
Credit: NOAO/AURA/NSF

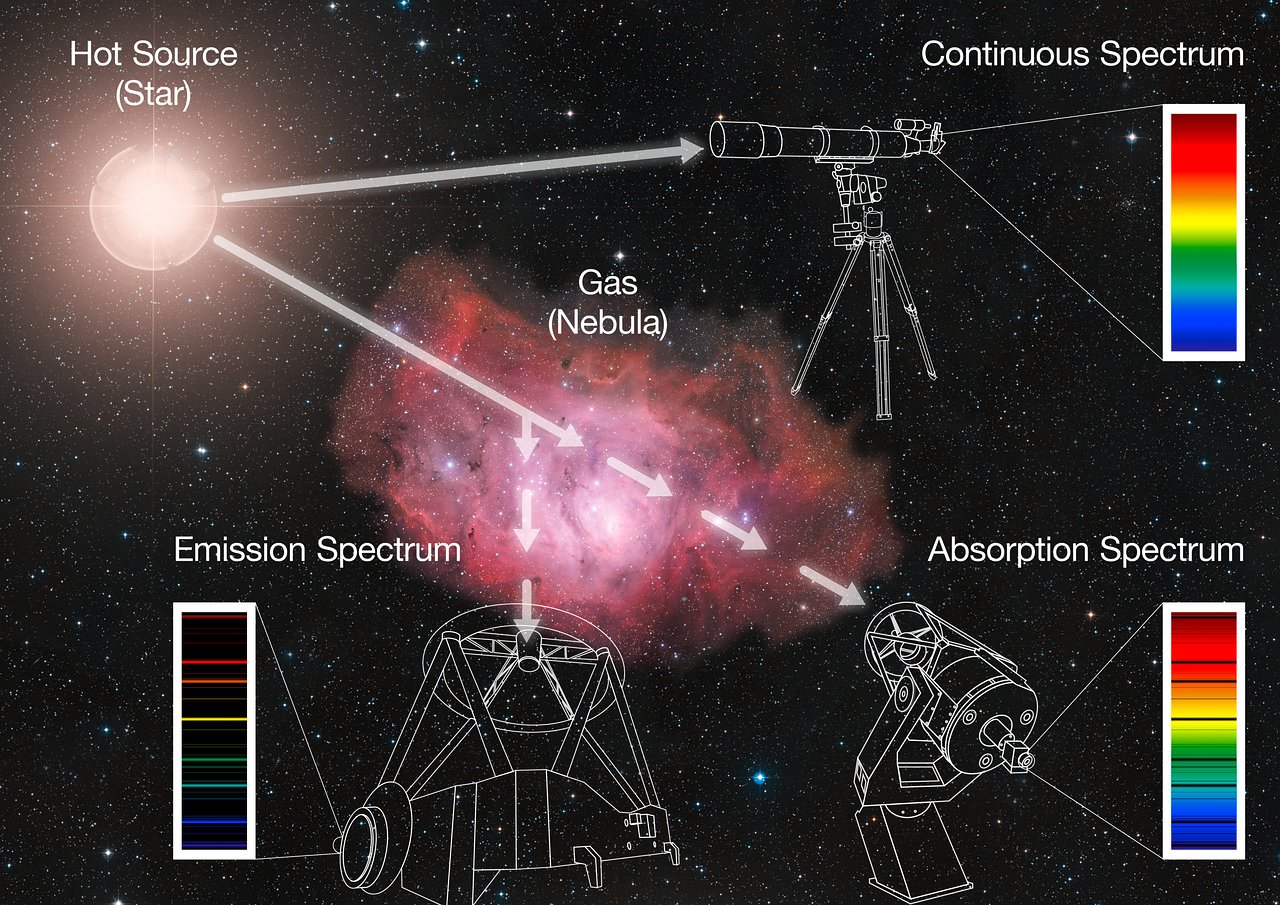
A star emits light across the spectrum — a continuum. When white light goes through a prism, it forms a rainbow, its spectrum. In the same way, as light from a star goes through the gas of a nebula — or even just the atmosphere of the star — specific colours (or wavelengths) are absorbed by the elements contained in the gas, producing dark lines over the continuum. This is an absorption spectrum. The energy that is absorbed by the gas is then re-emitted in all directions, also at the specific colours characteristic of the elements present in the gas, producing bright lines at certain wavelengths; this is known as an emission spectrum.
Spectrographs are fundamental pieces of astronomical instrumentation and they are far more sophisticated than a prism. Instead of a simple rainbow, the output is a spectrum in which the light is much more dispersed than in a rainbow. The spectra are recorded on a CCD detector and finally saved in computer files for further processing and analysis. The spectrum of a star or any astronomical object not only reveals the presence of certain chemical elements, but also informs about the prevailing physical conditions, such as temperature and density. Spectra can also tell us about motion: by using the Doppler effect, the speed of a star or a galaxy with respect to the Earth can be measured. This effect is used to discover extrasolar planets, and a similar effect allows astronomers to measure the distances to galaxies. Spectra also contain information on the magnetic field present in the object, the composition of the matter and much more.
Most of the telescopes at ESO’s observatories have spectrographs or have a spectroscopic mode. They cover different ranges of wavelength (from the near-ultraviolet to the mid-infrared) and offer different spectral resolutions (the higher the spectral resolution, the stronger the dispersion of the light, and the smaller the details of the spectrum that can be detected).

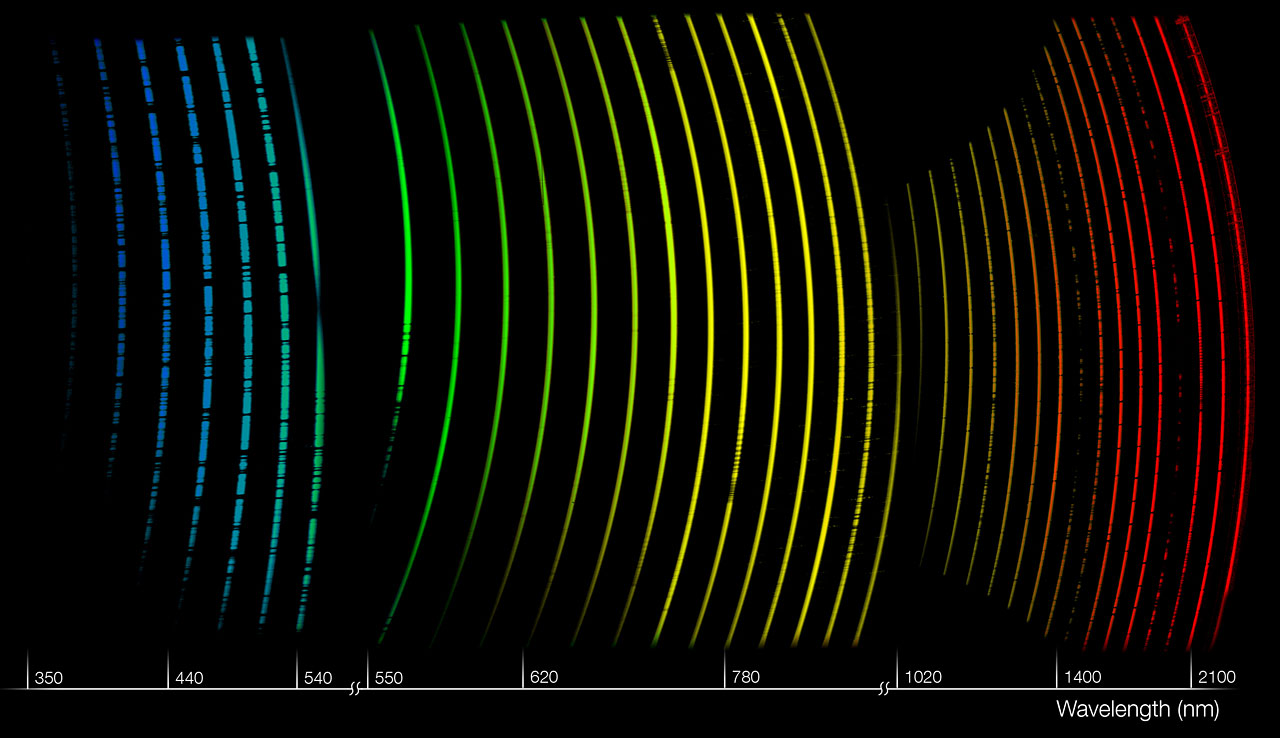
Illustration of a spectrum taken by X-shooter. This instrument can take simultaneous spectra of an object over a broad range of colours (or wavelengths), from ultraviolet to infrared.
Some spectrographs at the Very Large Telescope in Paranal produce high-resolution spectra like UVES and CRIRES; others obtain spectra of many objects at the same time like FLAMES and VIMOS; and a few, like KMOS, MUSE and SINFONI, can even take spectra over their whole field of view (see Integral Field Spectroscopy).
At the La Silla Observatory, the instruments installed at the New Technology Telescope (NTT), EFOSC2 (and its predecessor EMMI) and SOFI are also spectrographs. But HARPS, installed on the ESO 3.6-metre telescope, is certainly one of the most famous for its leading role in the detection of exoplanets.
The next generation of spectrographs, like those planned for the Extremely Large Telescope (ELT), will go beyond anything we can currently achieve. Among the things we cannot do today, astronomers expect to be able to look for possible traces of life in the atmospheres of exoplanets similar to Earth. If signs of life are ever discovered on another planet, it’s most likely that the instrument involved will be a spectrograph.
Science highlights
ESO spectrographs provided key data to significant discoveries in different fields of astronomy:
- ESO Top 10 Astronomical Discoveries
- Solar System bodies, exoplanets and brown dwarfs: see CRIRES science highlights;
- Exoplanets: see HARPS science highlights;
- Stellar populations: see FLAMES science highlights;
- Cosmology: see UVES science highlights;
- Supermassive black hole in the centre of the Milky Way: see SINFONI science highlights;
- Galactic evolution: see VIMOS science highlights.


