| This documentation is intended both for QC scientists and SciOps astronomers (who may want to ignore the technical information displayed in grey). | |||||||||||||||||||||||
|
|||||||||||||||||||||||
| bottom plots | contact | |||||||||||||||||||||||
| NAME | bias_qc_2CCD.prg | ||||||||||||||||||||||
| VERSION | 4.1 -- 22/04/2001 P. Sartoretti modified to deal with CHIP 1&2 in FORS2 4.2 -- 2007-04-02 smoehler modified to deal with CHIP 1&2 in FORS1 4.3 -- 19/03/2008 smoehler modified for new imaging pipeline | ||||||||||||||||||||||
| SYNTAX | MIDAS | ||||||||||||||||||||||
| CALL |
measureQuality from $DFS_PRODUCT/BIAS/$DATE: inmidas -P -j "@@ $DFO_PROC_DIR/bias_qc_2CCD.prg $date $PF" | ||||||||||||||||||||||
| INSTRUMENT | FORS1 | ||||||||||||||||||||||
| RAWTYPE | BIAS | ||||||||||||||||||||||
| PURPOSE | compares raw and product BIAS files for FORS1 QC assessment; the plots are later reviewed within certifyProducts. The first plot (bias_grap1.png) is stored as Postscript file in $DFO_PLT_DIR. | ||||||||||||||||||||||
| PROCINPUT |
first raw BIAS from AB; MASTER_BIAS product; | ||||||||||||||||||||||
| QC1TABLE |
trending | table(s) in QC1 database: fors1_bias_2CCD | ||||||||||||||||||||||
| TRENDPLOT |
trending | HealthCheck plot(s) associated to this procedure: trend_report_BIAS_med_master_HC.html | ||||||||||||||||||||||
| QC1PAGE |
trending | associated documentation: bias_2CCD_qc1.html | ||||||||||||||||||||||
| QC1PLOTS top |
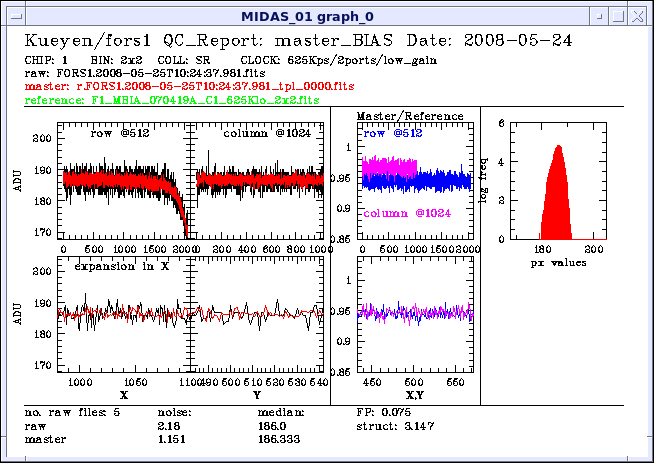
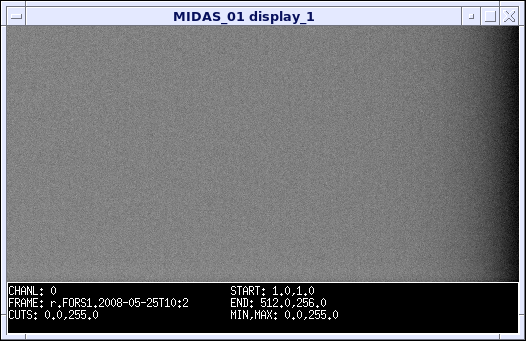
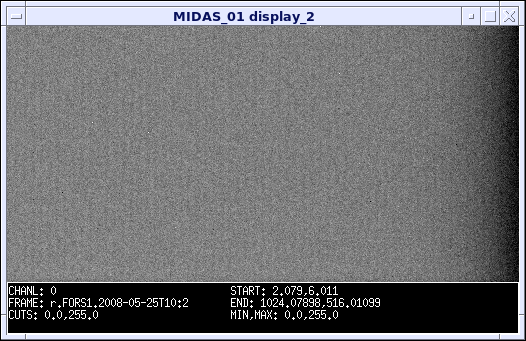
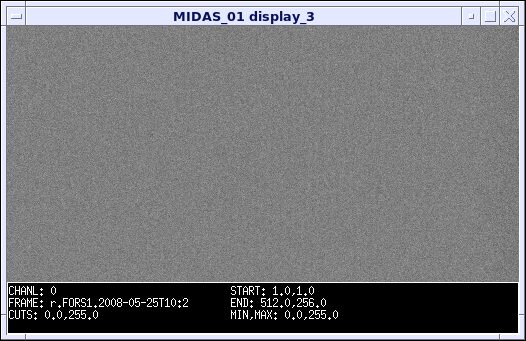
bias_grap1.png left: comparison master (red) <-> raw (black); upper panel: middle row and middle column, full pixel range, in ADU; lower panel: middle row and middle column, central 100 pixels, in ADU center: ratio master/reference upper panel: middle row and middle column, full pixel range, in ADU; lower panel: middle row and middle column, central 100 pixels, in ADU right: histogram: all pixel values of master bias in log frequency histogram (red), should show a dominant peak with Gaussian shape (which translates to parabola shape in this log freq diagram) top panel: date; name of analyzed master bias frame (red), first raw frame (black), reference frame (green) bottom panel: some QC1 parameters- number of raw files; sigma (raw); median (raw, master) bias_disp1.png full display of master frame bias_disp2.png full display of first raw frame bias_disp3.png full display of ratio master/reference (cuts=0.8,1.4) | ||||||||||||||||||||||
| QC1PARAM |
QC1 parameters written into QC1 table: QC1db names: datancom | median_master | master_ronexp | median_raw FITS key names: DATANCOM | MBIAS.LEVEL | MBIAS.RONEXP | BIAS.LEVEL QC1db names: struct | RON_r | FP_r | struct_r FITS key names: MBIAS.STRUCT | BIAS.RON | BIAS.FPN | BIAS.STRUCT QC1db names: noise_master | ratio_master FITS key names: MBIAS.NOISE | MBIAS.NRATIO QC1 params created by pipeline: all | ||||||||||||||||||||||
| ALGORITHM | |||||||||||||||||||||||
| CERTIF |
Reasons for rejection: - unusually high bias level or RON level (unless representative); - unusual structure (1x1 binning shows a bright row in chip 2 - that is ok); - non-Gaussian shape of histogram; - DATANCOM lower than usual (5), especially if N=5 version nearby in time | ||||||||||||||||||||||
| COMMENTS | |||||||||||||||||||||||
| top | [2009-07-30T07:16:42] created by qcDocu v1.1, a tqs tool | ||||||||||||||||||||||