| This documentation is intended both for QC scientists and SciOps astronomers (who may want to ignore the technical information displayed in grey). | |||||||||||||||||||||||
|
|||||||||||||||||||||||
| bottom plots | contact | |||||||||||||||||||||||
| NAME | std_ima_qc_2CCD.prg | ||||||||||||||||||||||
| VERSION |
1.0 -- 08/2002 set mag-ap radius of 10arcsec to try to decrease
errors (before was 20, but now the stars are not
"defocused" so much with the onecal used
now) 2.0 -- 04/2006 use SExtractor magnitudes instead of MIDAS MAG_AP after fixing MASK_TYPE 2.1 -- aligned.fmt modified to have Sextractor magnitudes in final output (after fixing MASK_TYPE) 2.2 -- adapted for new FORS1 CCDs | ||||||||||||||||||||||
| SYNTAX | MIDAS | ||||||||||||||||||||||
| CALL |
measureQuality from $DFS_PRODUCT/STD_IMA/$DATE: inmidas -P -j "@@ $DFO_PROC_DIR/std_ima_qc.prg $date $PF" | ||||||||||||||||||||||
| INSTRUMENT | FORS1 | ||||||||||||||||||||||
| RAWTYPE | STD_IMA | ||||||||||||||||||||||
| PURPOSE | shows STD_IMA product files for FORS1 QC assessment; the plots are later reviewed within certifyProducts. The first plot (std_ima_grap1.png) is stored as Postscript file in $DFO_PLT_DIR. | ||||||||||||||||||||||
| PROCINPUT |
ALIGNED_PHOTOMETRY_TABLE; STANDARD_REDUCED_IMAGE | ||||||||||||||||||||||
| QC1TABLE |
trending | table(s) in QC1 database: fors1_zp_frame | ||||||||||||||||||||||
| TRENDPLOT |
trending | HealthCheck plot(s) associated to this procedure: trend_report_ZEROPOINTS_U_HC.html | ||||||||||||||||||||||
| QC1PAGE |
trending | associated documentation: zeropoints/zeropoints.html | ||||||||||||||||||||||
| QC1PLOTS top |
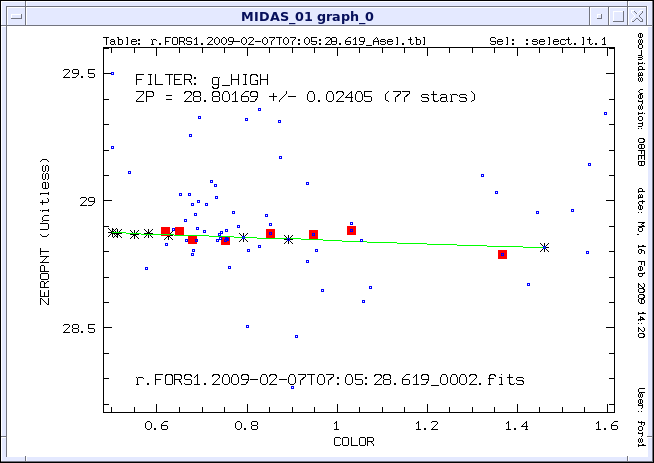
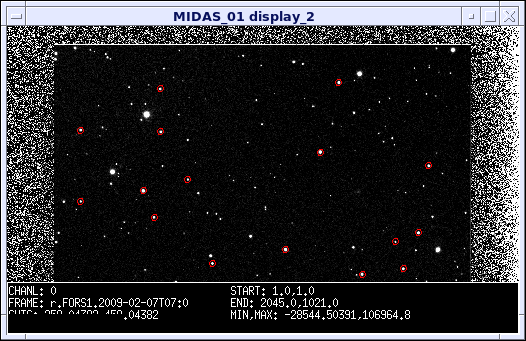
std_ima_grap1.png At the top the average zero point (corrected for airmass and colour terms and converted to electrons) its error, and the number of stars used for it, are given. All stars are plotted with small blue squares. Stars with normalized absolute weights of more than 0.05 are marked by asterisks. For more than 1 such star a linear regression zero point vs. colour is performed (green line). For more than 3 stars stars lying away from the fit by more than 1 sigma (fit uncertainty) are marked as outliers (red squares). The pipeline, however, does only a rejection of stars deviating by more than 0.3 mag from the median to brighter zeropoints. So the number of stars given at the top will usually deviate from the number of black asterisks. std_ima_disp1.png full display of reduced image with the positions of the identified standard stars with normalized absolute weights > 0.05 marked by red circles. | ||||||||||||||||||||||
| QC1PARAM |
QC1 parameters written into QC1 table: QC1db names: num_stars | zp_frame | sig_zp_frame | ext_coeff | err_ext_coeff FITS key names: QC ZPOINT NSTARS | QC ZPOINT | QC ZPOINTRMS | QC EXTCOEFF | QC EXTCOEFFERR | ||||||||||||||||||||||
| ALGORITHM | |||||||||||||||||||||||
| CERTIF |
Reasons for rejection: - mis-identifications (e.g. standard stars identified outside the field of view) Elliptical shapes are not a cause for rejection. | ||||||||||||||||||||||
| COMMENTS | It is usual that for a given series of STD_IMA observations only one chip gives a zeropoint. Usually the sequence is then repeated for the other chip. | ||||||||||||||||||||||
| top | [2009-07-30T07:17:07] created by qcDocu v1.1, a tqs tool | ||||||||||||||||||||||