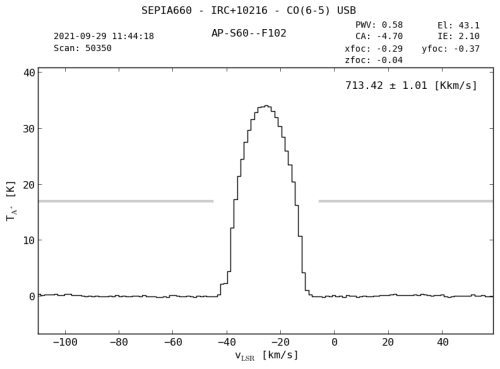
A new interactive Grafana dashboard has made publicly available with the relevant results of the line intensity monitoring program, part of the APEX observatory calibration plan. An automated data reduction pipeline has recently been developed by the APEX Sciops team to analyse the scans of reference CO and HCN transitions in pointing sources. This new interface allows PIs to access the database with all these calibration observations, irrespectively of which specific project the observation was taken on.
APEX Heterodyne Line Intensity Monitoring Is Now Online

As part of the calibration plan of the APEX heterodyne instrumentation, regular observations are conducted of these CO and HCN line pointing sources for all available receivers. These are supposed to be stable or non-variable molecular transitions. These observations are usually taken interleaved with the scientific data and are now automatically reduced, and the results stored in a database. By monitoring their measured line intensities, it is possible to track long-term variations of the antenna temperature scale, which are normally due to instrumental changes. This can be useful for example for long-term projects or when combining observations of the same target taken months or even years apart.
For more information please visit the APEX webpage - Observing - APEX data, or directly access the heterodyne line intensity monitor.
