
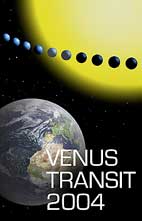
The Venus Transit 2004
... Educational Sheet 4
How to estimate the Earth-Sun Distance by means of trigonometry and a model of the Phases of Venus
Lars Petersen, Alan C. Pickwick, Rosa M. Ros, Mogens Winther (EAAE)
Level: Some mathematical ability is required.
Objectives:
- To use the transit of Venus to determinate the distance to Venus and to the Sun.
Background
The students need to know:- Mathematical content
- Definition of the sine function
- Sine Theorem
- Latitude and Longitude
- Declination
- Parallax
Assumptions
We assume that:- All measurements are performed close to local noon (the Sun being in the South)
- Both observers on are the same meridian
- The centres of the Sun, Venus and the Earth are coplanar
- The original lab exercise also assumes that the data for measuring Venus' orbit are made with declination equal to zero
- These approximations are made because they are reasonable and we want to reach as large an audience as possible.
Materials needed
- A pocket calculator (may be performed without astronomical equipment).
- Candlelight.
- Table tennis balls.
- If you have an astronomical telescope, that will be fine - but neither a telescope nor other expensive equipment is needed.
Resources
- A lab experiment to understand and visualise the phases of Venus. The students will repeat Galileo's first proof of 1610 that the Sun, and not the Earth, is at the centre of our planetary system.
Introduction
We will use the transit of Venus observations to calculate the Earth - Sun distance. The phenomena are similar to the transit of Mercury which it was possible to observe from Europe in 2003.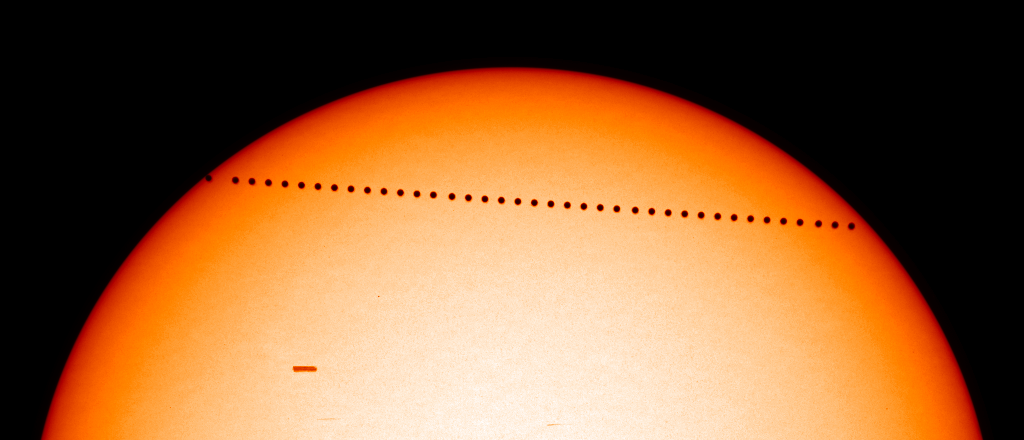
Imagine two observers, one at position 2 (the subsolar point) and the other at position 1, further to the North.
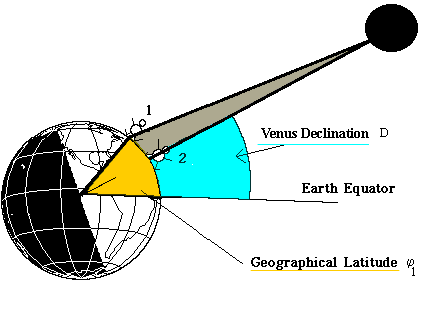
In general, observers' positions on the globe are defined by their longitudes and latitudes. You may find your own latitude from any geographical atlas, or by means of this collection of WWW interactive maps.
In the following pages we consider the situation where both observers are situated at approximately the same longitude. In addition, we restrict our attention to the end of the transit, when the Sun is approximately due South, thus allowing a simple approximation.
The latitude of Observer 1 relative to the equator is marked in yellow. From the drawing it is obvious that Observer 1 sees Venus at a lower angle than does Observer 2. So as we move towards more northerly latitudes we see that the declination of Venus appears to decrease. You have probably been in a similar situation: as you climb a tree, you look down more and more on your neighbours. This is the parallax effect, mentioned previously.
The trigonometry of the transit
This drawing shows in more detail how much the declination of Venus decreases as we move from position 2 to position 1: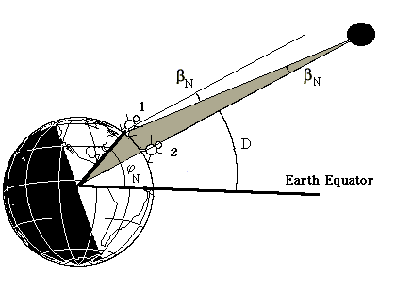
Note, how the small angle ß beta (indicated in the figure) occurs at two places. The drawing below shows how we may find beta :
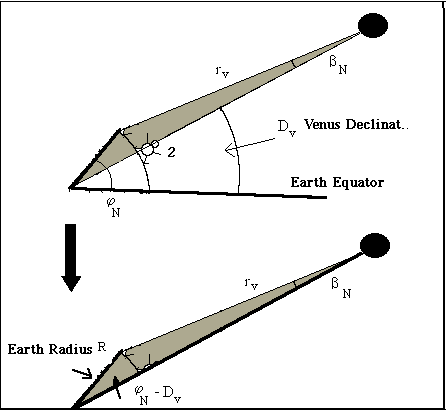
If we apply the Sine Theorem to the shaded triangle above, we find:
| sin (ß N ) = R | sin(Ψ N - D v ) |
|---|---|
| r v |
During the Venus Transit 2004 it would be nice to get data from both the northern and the southern hemisphere.
An observer at a position 3 - say South Africa - will get a parallax relative to position 2

Performing the same calculations as before - we get the following result for the southern red triangle
| sin (ß s ) = R | sin(D v - Ψ s ) |
|---|---|
| r v |
Applying the approximation (valid if beta is small and measured in radians):
sin(ß) ≈ ß
We get this approximation:
| ß N + ß s = | R | (sin(Ψ N - D v ) + sin(D v - Ψ s )) |
|---|---|---|
| r v |
which gives Venus ß Venus = ß N + ß s as
| ß Venus = | R | (sin(Ψ N - D v ) + sin(D v - Ψ s )) |
|---|---|---|
| r v |
or in simplified form:
| ß Venus = | K Venus |
|---|---|
| r v |
If we could measure the parallax of Venus ß V relative to the distant fixed stars, this formula could be used to find the distance of Venus. However, we are unable to see the stars during the daytime, so we have to measure the parallax relative to the Sun.
The solar distance is not infinite as the Sun has a parallax also.
This parallax ß Sun is (same formula as before):
| ß Sun = | K Sun |
|---|---|
| r s |
Observing the parallax of Venus relative to the Sun, will only give us the difference Δß between these two parallaxes:
Δß = ß Venus - ß Sun
or simply:
| Δß = ß Venus - ß Sun = | K Venus | - | K Sun |
|---|---|---|---|
| r v | r s |
We know that the Earth-Venus distance is 0.3 times the Earth-Sun distance, because r V /r S = 0.3. This makes the observed parallax Δß equal to
| Δß = | K Venus - 0.3K Sun |
|---|---|
| r v |
that is to say, the distance to Venus r V is
| r v = | K Venus - 0.3K Sun |
|---|---|
| Δß |
Test Calculations...
In case of bad weather - and as a preparation of what to expect - we now take a look at the real numbers involved.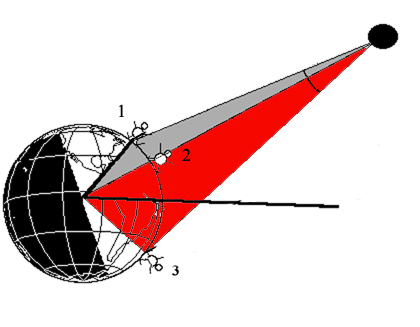
We have chosen two random positions, one in Europe (position 1) at Latitude North φ N = +55º and one in South Africa (position 3) at Latitude South φ S = - 30º. Both are in the same meridian in order to simplify the figure and the trigonometrical content of the geometrical problem.
We calculated previously the Solar declination, as seen from the centre of the Earth (or position 2) as being D S = + 22º.8897. In addition, we found the declination of Venus (geocentric) was D V = 22°.6788. The radius of the Earth, R = 6378 km.
Entering all the above values into the formulas, we are able to find both K Venus and K Sun. Please do this (remember, your pocket calculator should be set to "degrees") and you will get K Venus = 8482.2 km and K Sun = 8476.5 km.
Now, let us take a look at the parallax to be expected. Each position was entered into the Institut de Mecanique Celeste webpage.
For Venus we have three declinations: the geocentric DV, the declination for position 1 in the North hemisphere D V|N and for position 3 in the South hemisphere D V|S as shown in the figure below.
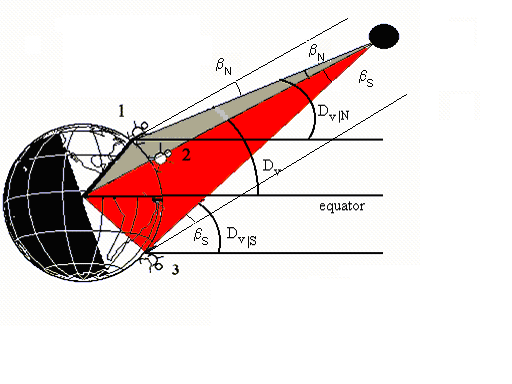
We can see directly from the figure ß N = D V - D V|N and ß S = D V|S - D V then
ß Venus = ß N + ß S = D V - D V|N + D V|S - D V = D V|S - D V|N
and by analogy
ß Sun = D S|S - D S|N
In position 1, at +55° Latitude North, we get declination values corresponding to the end of the transit, nearly local noon (1100 UT). The Solar Declination D S|N is +22º53'18".3999 and Venus' Declination D V|N is +22º40'27".5448.
In South Africa, at -30° Latitude South, we get the following values, also at local noon (1100 UT). The Solar Declination D S|S is +22º53'29".8560 and Venus' Declination D V|S is +22º41'07".8303.
Using 1'= 60", we see that the North South Venus Parallax ß Venus (difference in declination) becomes:
ß Venus = 22º41'07".8303 - 22º40'27".5448 = 40".2855
And using the solar values, we see the Solar Parallax ß Sun becomes
ß Sun = 22º53'29".8560 - 22º53'18".3999 = 11".456
We recall that the observed Parallax,
Δß = ß Venus - ß Sun = 40".2855 - 11".4561 = 28".8294
that is, approximately half a minute of arc. For comparison, the full angular size of the Sun is approximately 30 minutes.
Converting the parallax to degrees,
Δß = 28".8294 /3600 = 0º.0080
And then to radians,
Δß = 0º.0080 pi /180 = 1.39769⋅10 -4 radians
In order to calculate distances we enter all values into:
| r v = | K V - 0.3K S |
|---|---|
| Δß |
We now get
| r v = | 8482.2 - 0.3⋅8476.5 | = 46⋅10 6 km |
|---|---|---|
| 1.39769⋅10 -4 |
The official value is, for comparison: 43.217 106 km.
Again, using the results from our simple previous lab exercise we already know that r V /r S = 0.3,
then r S = 3.33 r V = 3.33⋅43⋅10 6 = 143⋅10 6 km
The official value is 149.6⋅10 6 km, so our simplified approach has a deviation of less than 5%.
The Sine Theorem
Any High School Mathematical text book tells us about the famous sine relation:
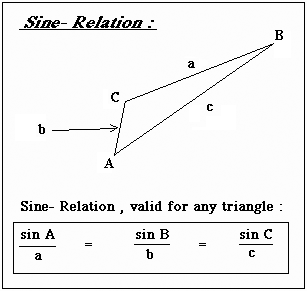
In our astronomical triangle, the length of "a" will be approximately equal to the length of "c".
Declination
Seasonal Variations
You have (probably) all noticed that during summer time shadows are short (left)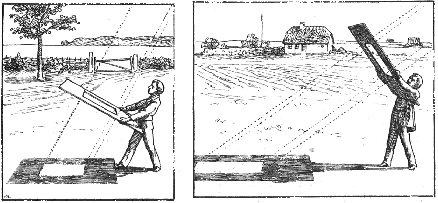
and during winter time shadows are long (right). So, the 'height' of the Sun (above the horizon) varies from season to season. This height is referred to as the altitude by astronomers.
Astronomers usually describe this variation by considering the conditions at the Earth's Equator:
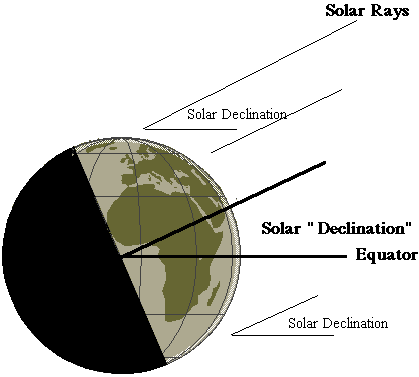
Note that the solar rays hit our planet at a certain angle with respect to the Equator. Astronomers call this angle the solar declination .
During the transit of Venus, the Sun will be positioned north of the equator so we experience Summer in the northern hemisphere. Mathematically speaking, at this time the Sun has a positive declination . The solar declination reaches a maximum at +23.44 degrees around 22 June.
During wintertime in the northern hemisphere, the Sun reaches its minimum declination, -23.44 degrees, around 22 December. Halfway between these two dates, that is, around 22 March and 22 September, the Sun's declination is nearly zero.
The exact declination values of the Sun and Venus have been measured by astronomers for centuries - knowing these values has been critical for navigating the oceans by means of sextants. Precise values may be found at this Institut de Mecanique Celeste webpage.
Applying the information from these webpages, we find that at the end of the Venus Transit, on 8 June at 1100 UT = 1300 Central European Summer Time, the Solar declination will be +22º 53' 22".9771 ("Geocentric" coordinates - as seen from the centre of the Earth).
Remember that 1 minute of arc is equal to 1/60 degree, and 1 second of arc is equal to 1/3600 Degree. So, converting into ordinary degree units, this becomes
Solar declination = ( 22 + 53/60 + 22.9771/3600 ) degrees = 22º.8897
Make a schematic drawing of the Earth, including the directions to the Sun and Venus. Will you observe the transit happening at the "upper" (northern) half, or the "lower" (southern) half of the Sun?
Lab exercise on the Phases of Venus
Venus will become a beautiful "evening star" during spring 2004. During autumn 2004 - the planet will be visible at the morning sky also. And - exactly on 8 June 2004 - Venus will perform a very rare transit across the solar disk.
This occasion will allow our students to estimate the distance to the Sun and to Venus.
However, in order to do so, we have first to investigate the orbit of our neighbouring planet. This chapter describes how this investigation can be done using simple maths and easy methods.
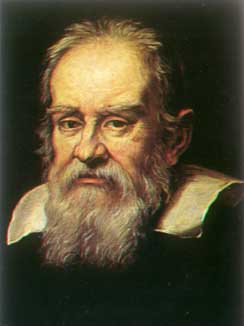
This idea originated with Galileo in 1610. The method shown below was the first scientific proof that the Sun, and not planet Earth was at the centre of our solar system.
By observing the phases of Venus, Galileo proved the heliocentricity of the solar system.
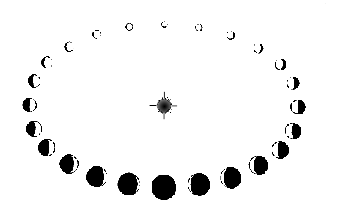
If you want to repeat Galileo's observations and proof, here is how to perform the several experiments.
Experiment 1
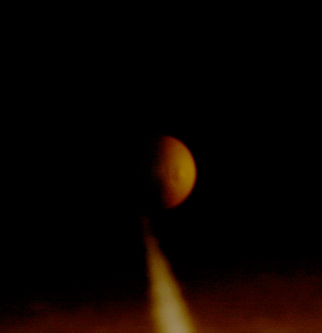
To observe the phases of Venus with a telescope or a pair of binoculars
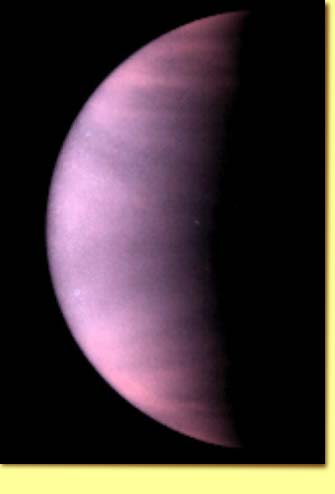
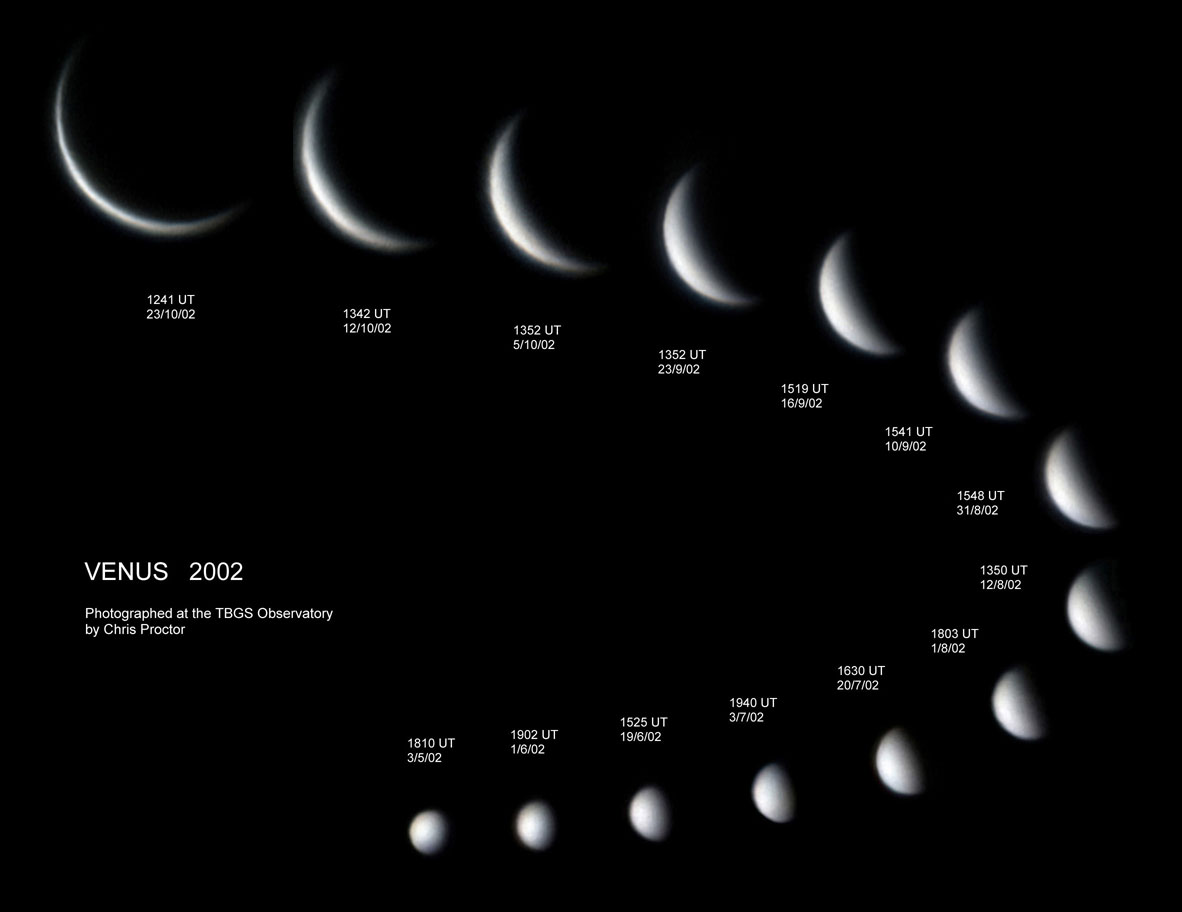
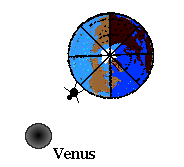
Try this yourself: Find a good telescope - an astronomical telescope with a magnification of 25-50 times is well suited for this task. When the Earth is very close to Venus, an ordinary pair of binoculars will even be sufficient. The picture below gives an indication of the phases you may observe.
Click to see a most detailed image - taken at the TGS observatory.
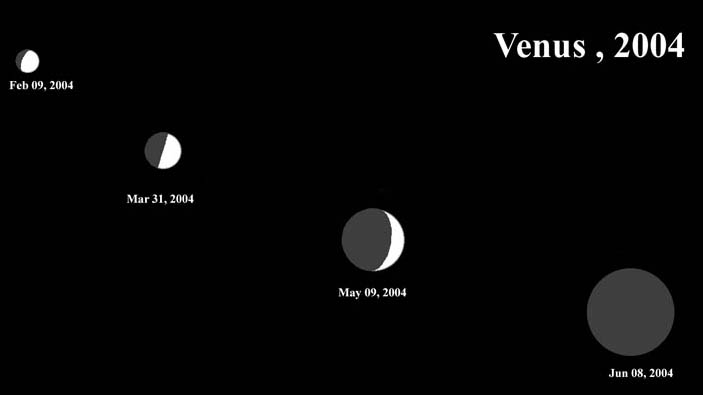
Please notice the nearly "half-moon" phase at the end of March 2004.
- Ask your students to bring a piece of paper and a pencil. Before the observations start, they have to draw a good circle on their paper.
- Now, observe the phases of Venus. One student from each group has to make a detailed drawing. Tell them they have to watch the planet for at least half a minute in order to enjoy the short moments of calm, steady air.
- Then, let them draw the phases in detail. Let the different groups compare their results, in order to see who is most accurate.
Experiment 2
How, by means of a lab activity, can these phases show that the solar system has the Sun at the centre?
In the following, we take an example based on a computer graphic for Mar 31 2004.
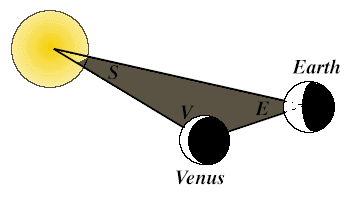
Now comes the trick. The Earth, the Sun and our sister planet Venus together form a gigantic triangle. We call the corresponding angles for the Earth, the Sun and Venus: "E", "S", and "V".
The angle E is very easy to estimate. The method below is not 100% accurate, but there is no need to introduce advanced maths for these simple measurements. On 31 Mar 2004, the Sun will be located due South at 12h 04m UT.
Venus however, will be due South at 14h 59m. The time difference:
E = 14h 59m - 12h 04m = 2 h 55 m = 2 + (55/60) h = 2.92 h. = 44º
As you know, the Earth rotates 360 degrees in 24 hours which corresponds to 15 degrees per hour. Therefore the time difference of 2.92 h corresponds to an angle of approximately 44 degrees. Now we are very close to the solution.
(If you have a measuring device like a sextant, the angle E may be measured directly in a more precise way, but do not forget a solar filter.)
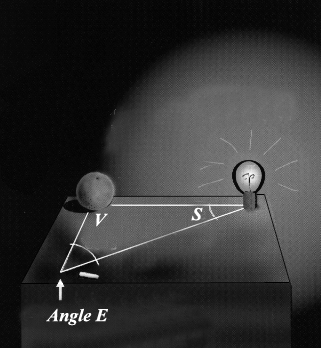
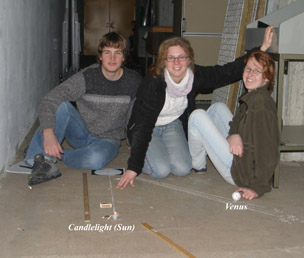
Go into your laboratory , and place a torch light, slide projector, or similar powerful light source on the floor. We will now try to make a scaled down version of our solar system:
- Take a piece of chalk, and draw a line, 1 metre long, going from the light source to where you stand. (Astronomers define this distance between the Sun and the Earth as "1 Astronomical Unit" = 1 AU. Modern measurements have shown that this distance is equal to 149.6 million km.)
- You now only have to draw the angle E, in our case above: 44 degrees.
- Extend the left leg of this 44 degree angle, so it runs out into the laboratory for say 2 metres.
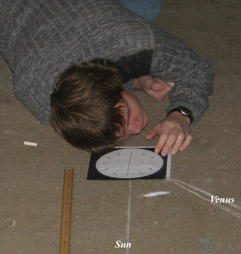
- Find a circular object (Galileo took an apple, but an orange is even better). Place it along the left leg. Let the light from the light source fall on the orange. Now observe how the phases vary as the distance increases.
- Vary the distance, until the phases correspond to our 31March 2004 image. Now you have a correct model of the solar system. Your students may measure directly the Earth-Venus distance, and the Sun-Venus distance.

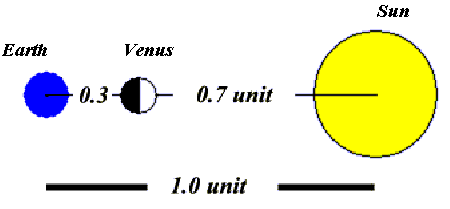
- On 31 March 2004 we have a 90º triangle as below:
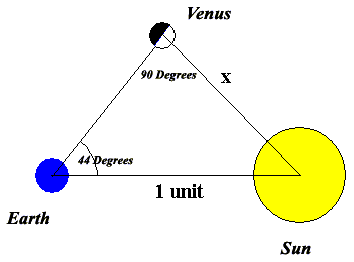
Putting the base line equal to "1 astronomical unit" (the Earth-Sun distance) - we may estimate the Venus-Sun distance by applying trigonometry (or by drawing):
X = 1 sin 44º = 0.7
During the 2004 transit, the situation will be as follows:

So the ratio of the distances of Venus and the Sun from the Earth becomes:
This result will be applied in our calculations.
- Calculate the angle E for the date of your observations, or for the drawing of 9 Feb 2004 or the drawing of 9 Apr 2004.
Detailed data may be found below - you should make a plot of these values against time - in order to estimate the data needed on your observation day.
| Sun - Venus Data 2004 | |||
|---|---|---|---|
| Day/Month | Solar Data | Venus Data | Angular Diameter |
| Jan 10 Evening Object | Sun 12h 07m | Venus 14h 34m | 13.3 arcseconds |
| Feb 09 Evening Object | Sun 12h 14m | Venus 14h 49m | 15.8 arcseconds |
| Mar 10 Evening Object | Sun 12h 10m | Venus 14h 55m | 19.8 arcseconds |
| Mar 31 Evening Object | Sun 12h 04m | Venus 14h 59m | 24.1 arcseconds |
| Apr 09 Evening Object | Sun 12h 01m | Venus 14h 59m | 27.0 arcseconds |
| May 09 Evening Object | Sun 11h 56m | Venus 14h 26m | 41.8 arcseconds |
| Jun 08 | Sun 11h 59m | Venus 11h 58m | 57.6 arcseconds |
| Jul 08 Morning Object | Sun 12h 05m | Venus 09h 33m | 40.7 arcseconds |
| Aug 07 Morning Object | Sun 12h 06m | Venus 08h 55m | 26.3 arcseconds |
| Aug 17 Morning Object | Sun 12h 04m | Venus 08h 54m | 23.4 arcseconds |
| Sep 06 Morning Object | Sun 11h 58m | Venus 09h 02m | 19.4 arcseconds |
| Oct 06 Morning Object | Sun 11h 48m | Venus 09h 19m | 15.5 arcseconds |
| Nov 05 Morning Object | Sun 11h 44m | Venus 09h 36m | 13.0 arcseconds |
Concerning angular size: 1 arcsecond = 1/3600 degree
- In the laboratory: - Once again move the orange until its shadows are comparable with the December drawing of Venus.
- Now measure the Sun-Venus distance, and the Earth-Venus distance.
- Please observe that the Earth-Venus distance has increased dramatically but the Sun-Venus distance has remained constant .
As you can see, these observational arguments are simple, and they convinced Galileo that Copernicus was right.
Click to compare with the official orbit values.
|