

Mapping the Universe in 3D
How ESO’s VIMOS spectrograph catalogued more than 90 000 galaxies
- How ESO’s VIMOS instrument helped map more than 90 000 galaxies
- How this survey allowed scientists to unveil the structure of the younger Universe
- How the VIPERS survey can help future projects
Q: Why is cosmology so exciting to you?
A: Ever since I was a kid, nature and the way things work have always fascinated me. This desire to understand how things work, at the deepest level, meant I would eventually become interested in either the very small or the very big. I ended up fascinated by the incredibly big: astronomy, in general, but mainly cosmology, which is related to the origins of everything, to the earliest questions in the Universe. It is connected to where the Universe comes from and how things originated from its homogenous initial state.
Q: Tell us about the VIPERS project. What was the initial aim?
A: VIPERS is a redshift survey, meaning we do a very simple thing: measure the distances of many, many galaxies to reconstruct their 3D distribution in a given volume of space. We have a way to reconstruct these distances because the Universe is quite kind to us: it’s expanding, and the apparent speed of expansion (which we see in the spectrum of each galaxy) is directly connected to the galaxy’s distance from us. The more distant galaxies are, the more rapidly they fly away from us, so the light we see from these galaxies is shifted towards the red. Thanks to this property of the Universe, we can get an approximation of their distance.
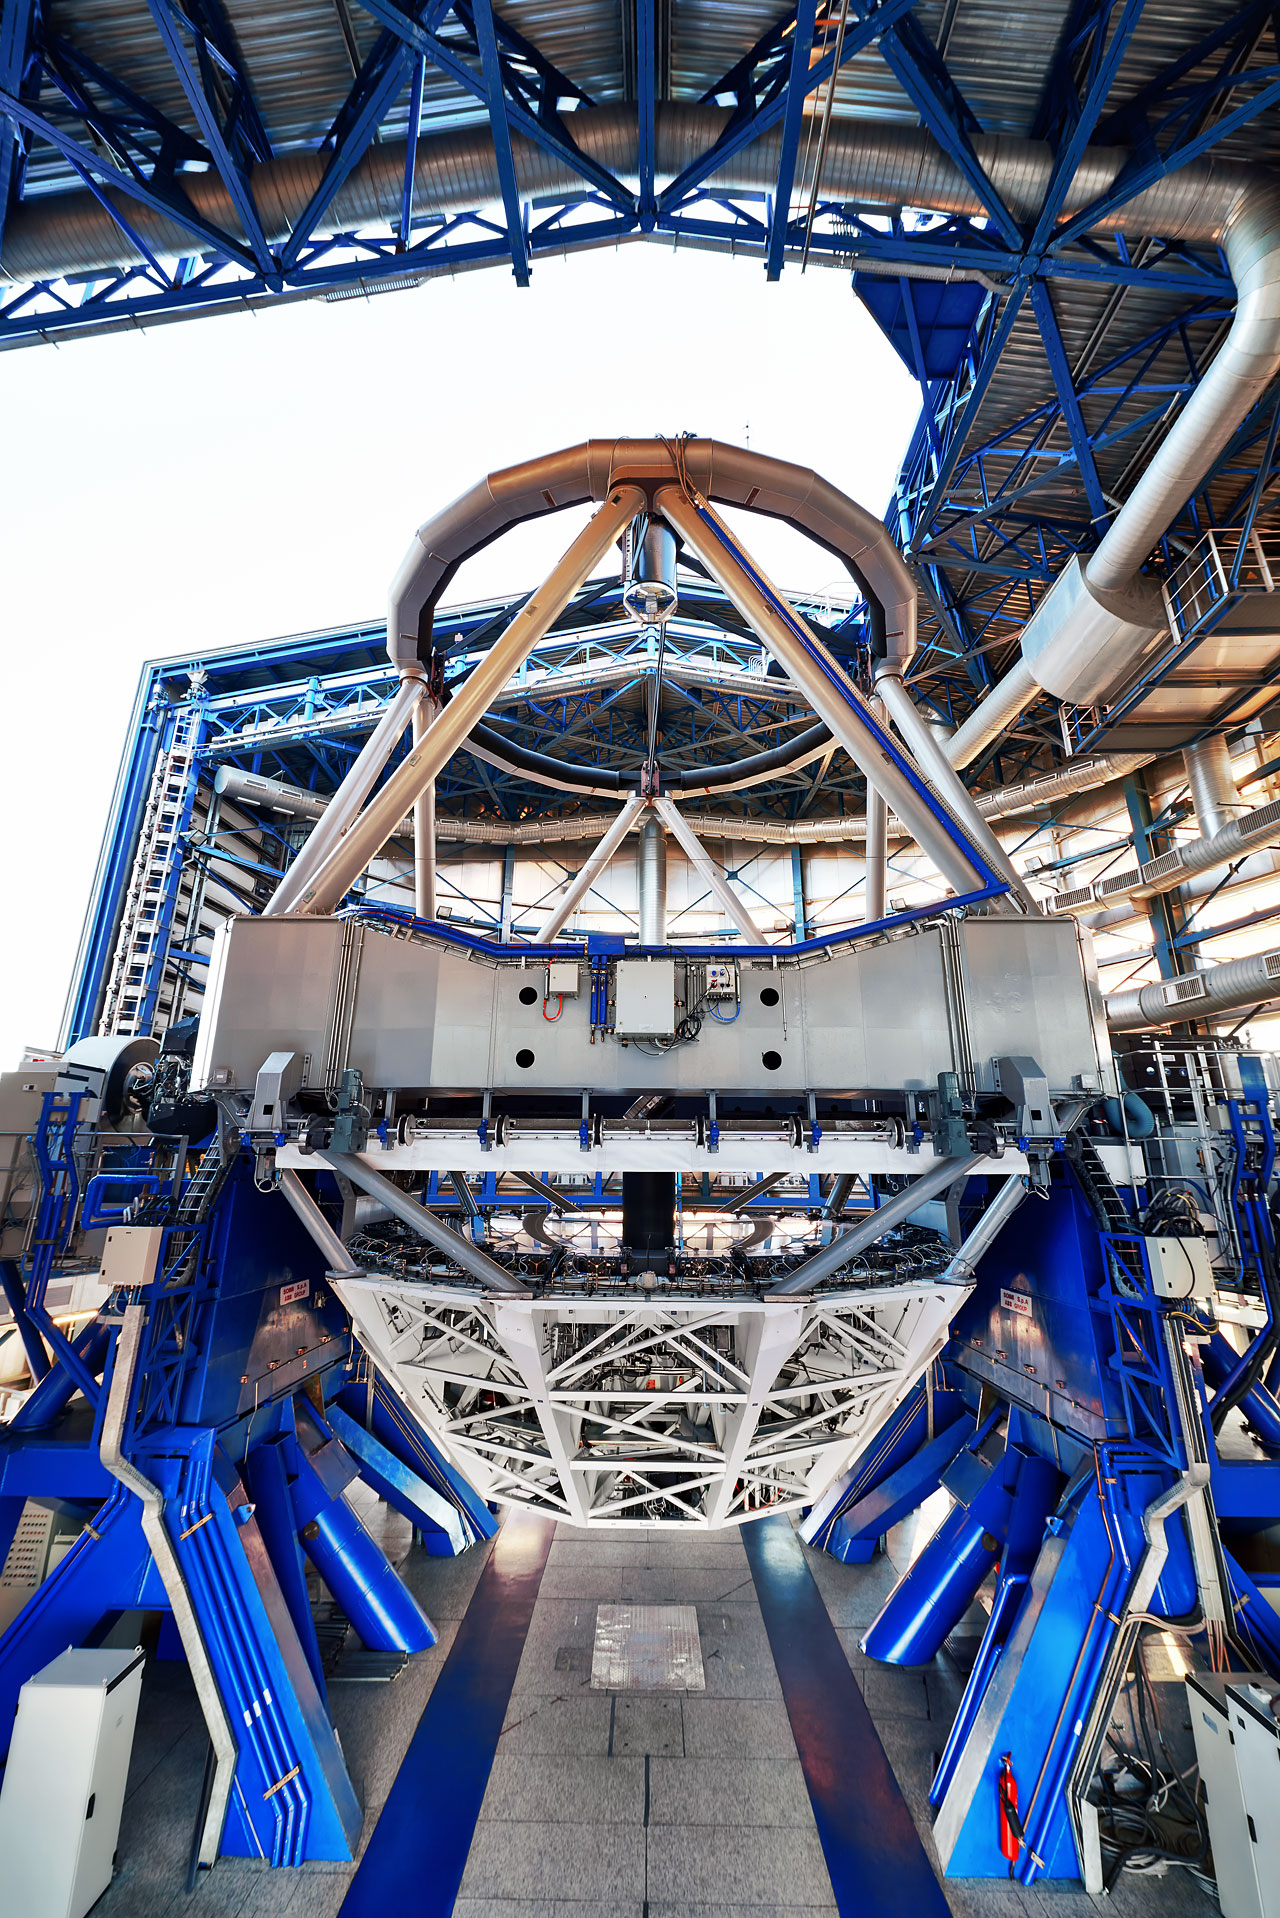
VIPERS is the last in a series of deep surveys that began when VIMOS, the spectrograph at ESO’s VLT, was built at the end of the 1990s. VIMOS is very efficient, capable of collecting different spectra for 400–500 objects at the same time.
Q: How do you measure the redshift of these galaxies?
A: Essentially you take the light from galaxies or stars and send it through a spectrograph. A spectrograph is just a prism that splits light into colours like a rainbow. It shows you that in the spectra of stars and galaxies there are hydrogen lines, oxygen lines, iron lines, and so on — the same chemical elements that we know on Earth. These emission or absorption lines have a specific position and a specific wavelength, but decades ago astronomer Edwin Hubble and collaborators noticed that when looking at the spectra of other galaxies, the positions of these lines were moved, shifted towards the red. They also noticed that this shift was higher for more distant galaxies — and this is actually how the expansion of the Universe was discovered.
Q: Why did you choose to catalogue 90 000 galaxies?
A: Usually astronomers have to make compromises between their grand scientific aims and what the instrument they’re using actually allows them to do. VIMOS is very special in this respect because there is no other spectrograph in the world that allows you to have the same combination of area of the spectrograph and density of objects that you can observe simultaneously. This makes VIMOS ideal to do these surveys in the distant Universe.
We chose to survey 90 000 galaxies in order to cover a volume comparable to the volumes we observed at the smaller redshifts (that is, nearby), because we wanted to compare the statistics. We wanted to look over as large a volume of space as possible, but we still wanted the galaxies to be close enough together to allow us to see the details of galactic structures. So we compromised at 90 000.

Q: So what did this survey tell us about the Universe?
A: We actually learned a lot about Einstein’s theory of general relativity, which is something we thought about when we proposed the VIPERS project. Galaxies tend to move towards regions of higher density, so, in some way, these galactic motions reflect the growth of the structure of the Universe. As time passes this structure keeps condensing, so when you measure the redshift, you are including this little velocity component that actually contains information about the dynamics of the Universe — and you can use it to determine how quickly these structures grow. In other words, it is a way to test the theory of relativity.
So, if you have modifications of general relativity on a very large scale, these could be “visible” in the way galaxies assemble. One way to explain such modifications is to include them in the equations of general relativity: as what Einstein called the cosmological constant. We don’t yet understand the origin of this constant, and since it is so difficult to understand in terms of theoretical physics, people started thinking that perhaps it’s not the right solution, perhaps you have to modify general relativity at large scales. This was one of the driving ideas for VIPERS. We presented four measurements of the growth of structure, using four different techniques from the same data, which we published over the past year.
Q: So what were the main conclusions of the survey?
A: Essentially all of our measurements are consistent with general relativity. With VIPERS we could see how different types of galaxies trace the structure. For example, we discovered that if we used the luminous blue galaxies, then the measurements of this growth rate are more accurate and less biased.
Unexpectedly, this survey also allowed us to measure cosmic voids — the spaces between large-scale galactic structures. By looking at cosmic voids with VIPERS, we could see the way galaxies flow away from these voids, because voids are underdense regions, so the galactic structures around them tend to squeeze.

Equally important, I think, were our results on galaxy evolution. These are really outstanding — by combining VIPERS and the existing Sloan Digital Sky Survey data of the local Universe, we could cover 9 billion years of evolution to see how galaxies transform from the early Universe to today. We saw how galaxies change their colour over time. Back in the earlier Universe, we saw a fraction of massive blue galaxies (meaning they are young, active, and still forming stars) which are no longer around today. They’ve become red as they grow older, so the number of red massive galaxies grows while the number of blue massive galaxies declines. That’s a very important result.
What’s really amazing is that even though we observed 90 000 galaxies, VIPERS was only conducted in 440 hours of observing time. The amount of information it produced is incredible.
Q: Did you learn any new techniques that might be useful for other projects or fields?
A: Definitely. What we learned about the instrumentation and the data reduction is now going to be used for a big project of the European Space Agency called Euclid, a space telescope with a spectrograph and an imager on board that will be launched in 2021. My team is involved in the spectroscopic part of the project — which is very different and much more complicated to use than VIMOS, but our work on VIPERS with VIMOS will help us when looking at data from Euclid.
Q: Is there anything left to do on the VIPERS project?
A: There are a few more papers in preparation, where we look at more specific details, in particular on the galactic evolution side. In terms of cosmology, I think it is basically done — but our dataset is still a great playground for people who want to test new methods, and we hope the sample will be used a lot by other people with smart ideas, who may find something unexpected. That’s the beauty of these large redshift surveys: the discovery space that you open.
As a final note, I just want to add that the support from the ESO staff to this project has been really great. One of the reasons why the project went well was because they supported us and always responded promptly to our request and questions.
Numbers in this article
|
400–500 |
The number of different objects for which VIMOS collected spectra in one single exposure. |
|
440 |
Number of observing hours in the project |
|
90 000 |
Number of galaxies observed during VIPERS survey |
Biography Luigi Guzzo
Luigi Guzzo is Professor of Cosmology at the University of Milano. He is a cosmologist, interested in observing and modelling the large-scale structure of the Universe. Over the past decade he has led the VIMOS Public Extragalactic Redshift Survey (VIPERS) with the ESO VLT and he is now one of the core science coordinators of the ESA mission Euclid, a space telescope to map the dark and luminous Universe, due to launch in 2021. In 2012 he has received an Advanced Grant from the European Research Council (ERC), a five-year financial contribution that sustained the development of new analysis methods and their application to VIPERS and other surveys.