| This documentation is intended both for QC scientists and SciOps astronomers (who may want to ignore the technical information displayed in grey). | ||||||||||||||||||||||||
|
||||||||||||||||||||||||
|
||||||||||||||||||||||||
| bottom plots | contact | ||||||||||||||||||||||||
| NAME | run_data_quality_processQC.sh | |||||||||||||||||||||||
| VERSION | 1.0 | |||||||||||||||||||||||
| SYNTAX | SHELL | |||||||||||||||||||||||
| CALL |
processQC -a abname or . $DFO_PROC_DIR/run_data_quality_processQC.sh $RAW_TYPE $DATE $PF $AB | |||||||||||||||||||||||
| INSTRUMENT | MIDI | |||||||||||||||||||||||
| RAWTYPE | all of them | |||||||||||||||||||||||
| PURPOSE |
This QC procedure is calling the other QC procedures depending of the RAW_TYPE RAW_TYPE=CAL/SCI_HS/SP_FRT : calling extractVis_dispersed.csh: extract Vis data for further plotting RAW_TYPE=CAL_HS/SP_FRT : calling extractTF_dispersed.csh extract the TF data for further plotting RAW_TYPE=CAL_HS/SP_FRT : calling extractbinned_dispersed.csh extract binned data RAW_TYPE=CAL/SCI_HS/SP_FRT : calling plot_data_dispersed.csh to create some of the QC1 plots (Vis) RAW_TYPE=CAL_HS/SP_FRT : calling midi_frg_sp/hs_disp_display.prg create the main QC1 plots | |||||||||||||||||||||||
| PROCINPUT | under dfs_products/RAW_TYPE | |||||||||||||||||||||||
| QC1TABLE |
trending | table(s) in QC1 database: midi_calibrators | midi_TransferFunction | midi_science_fringe | |||||||||||||||||||||||
| TRENDPLOT |
trending | HealthCheck plot(s) associated to this procedure: trend_report_TF_HC.png | |||||||||||||||||||||||
| QC1PAGE |
trending | associated documentation: fullTF_qc1.html | |||||||||||||||||||||||
| QC1PLOTS top |
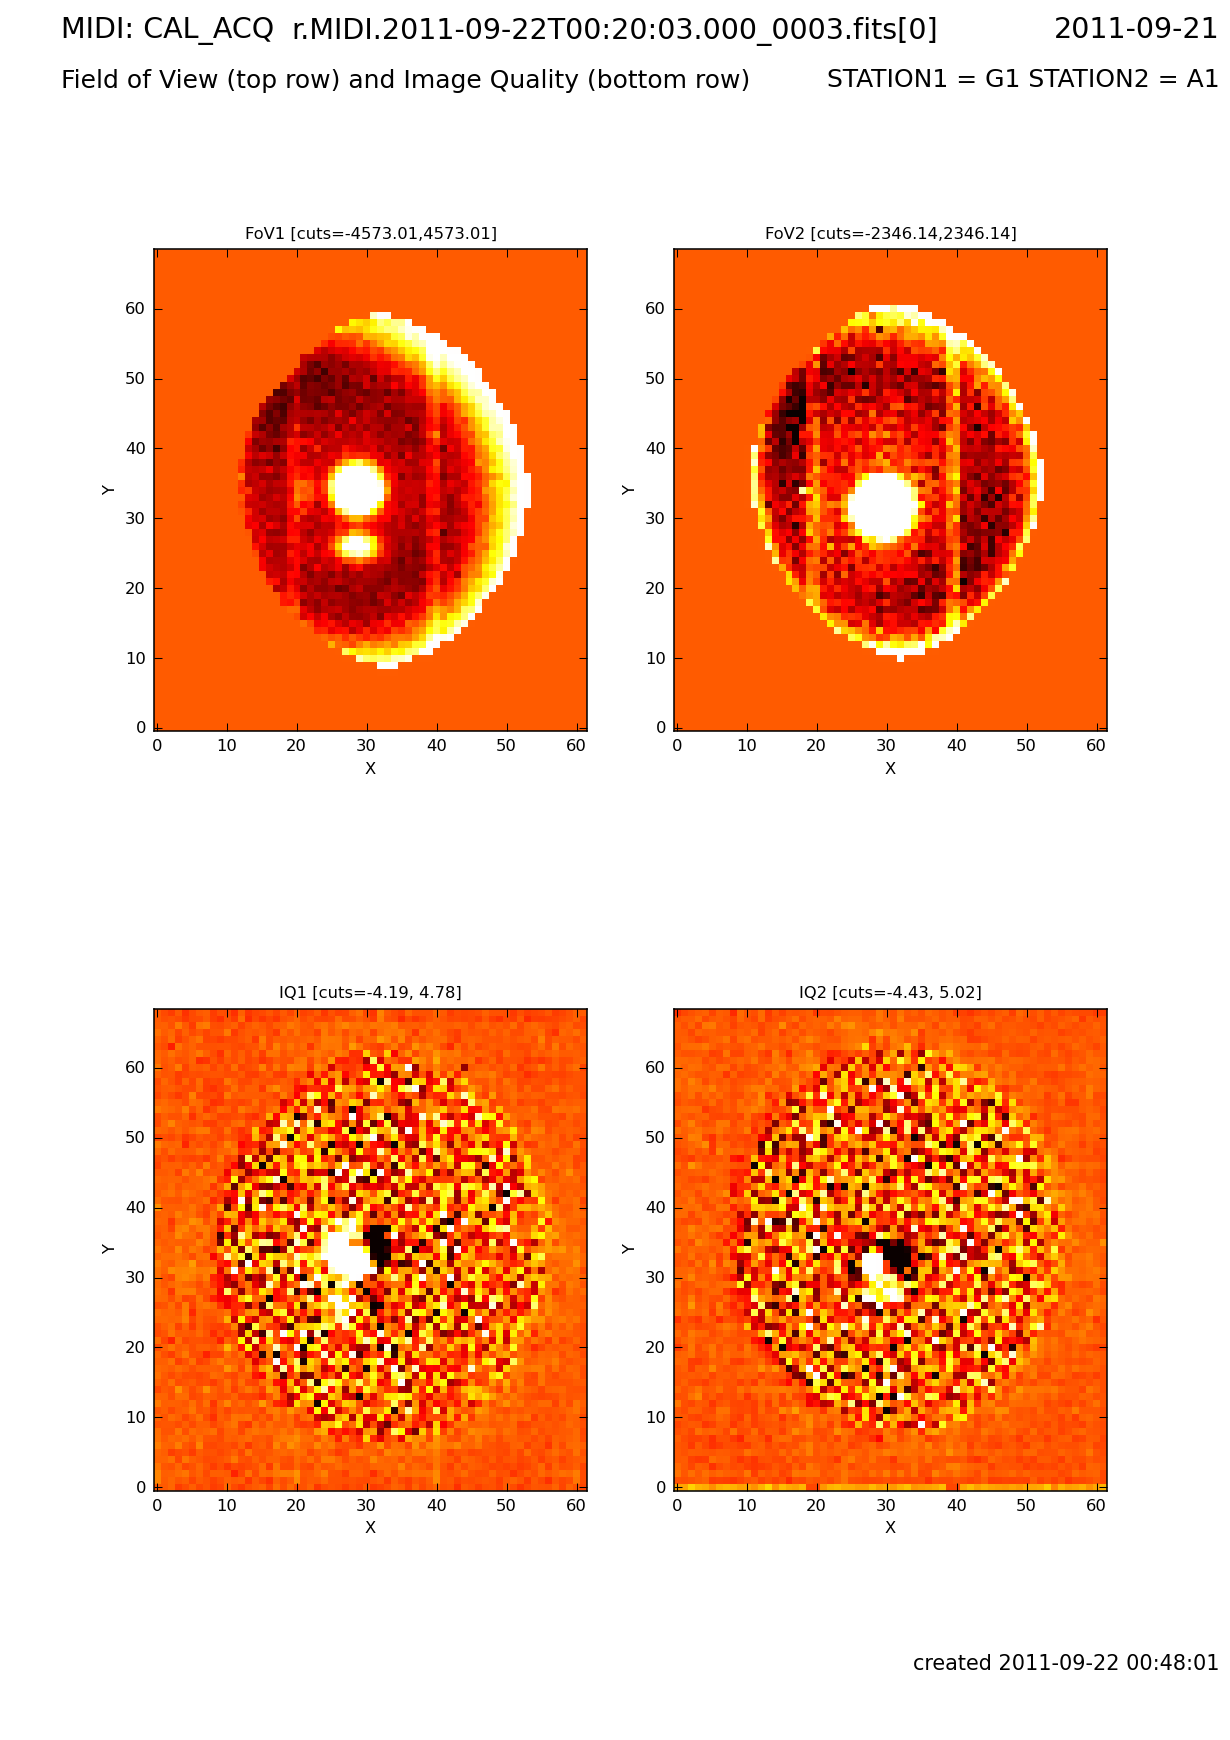
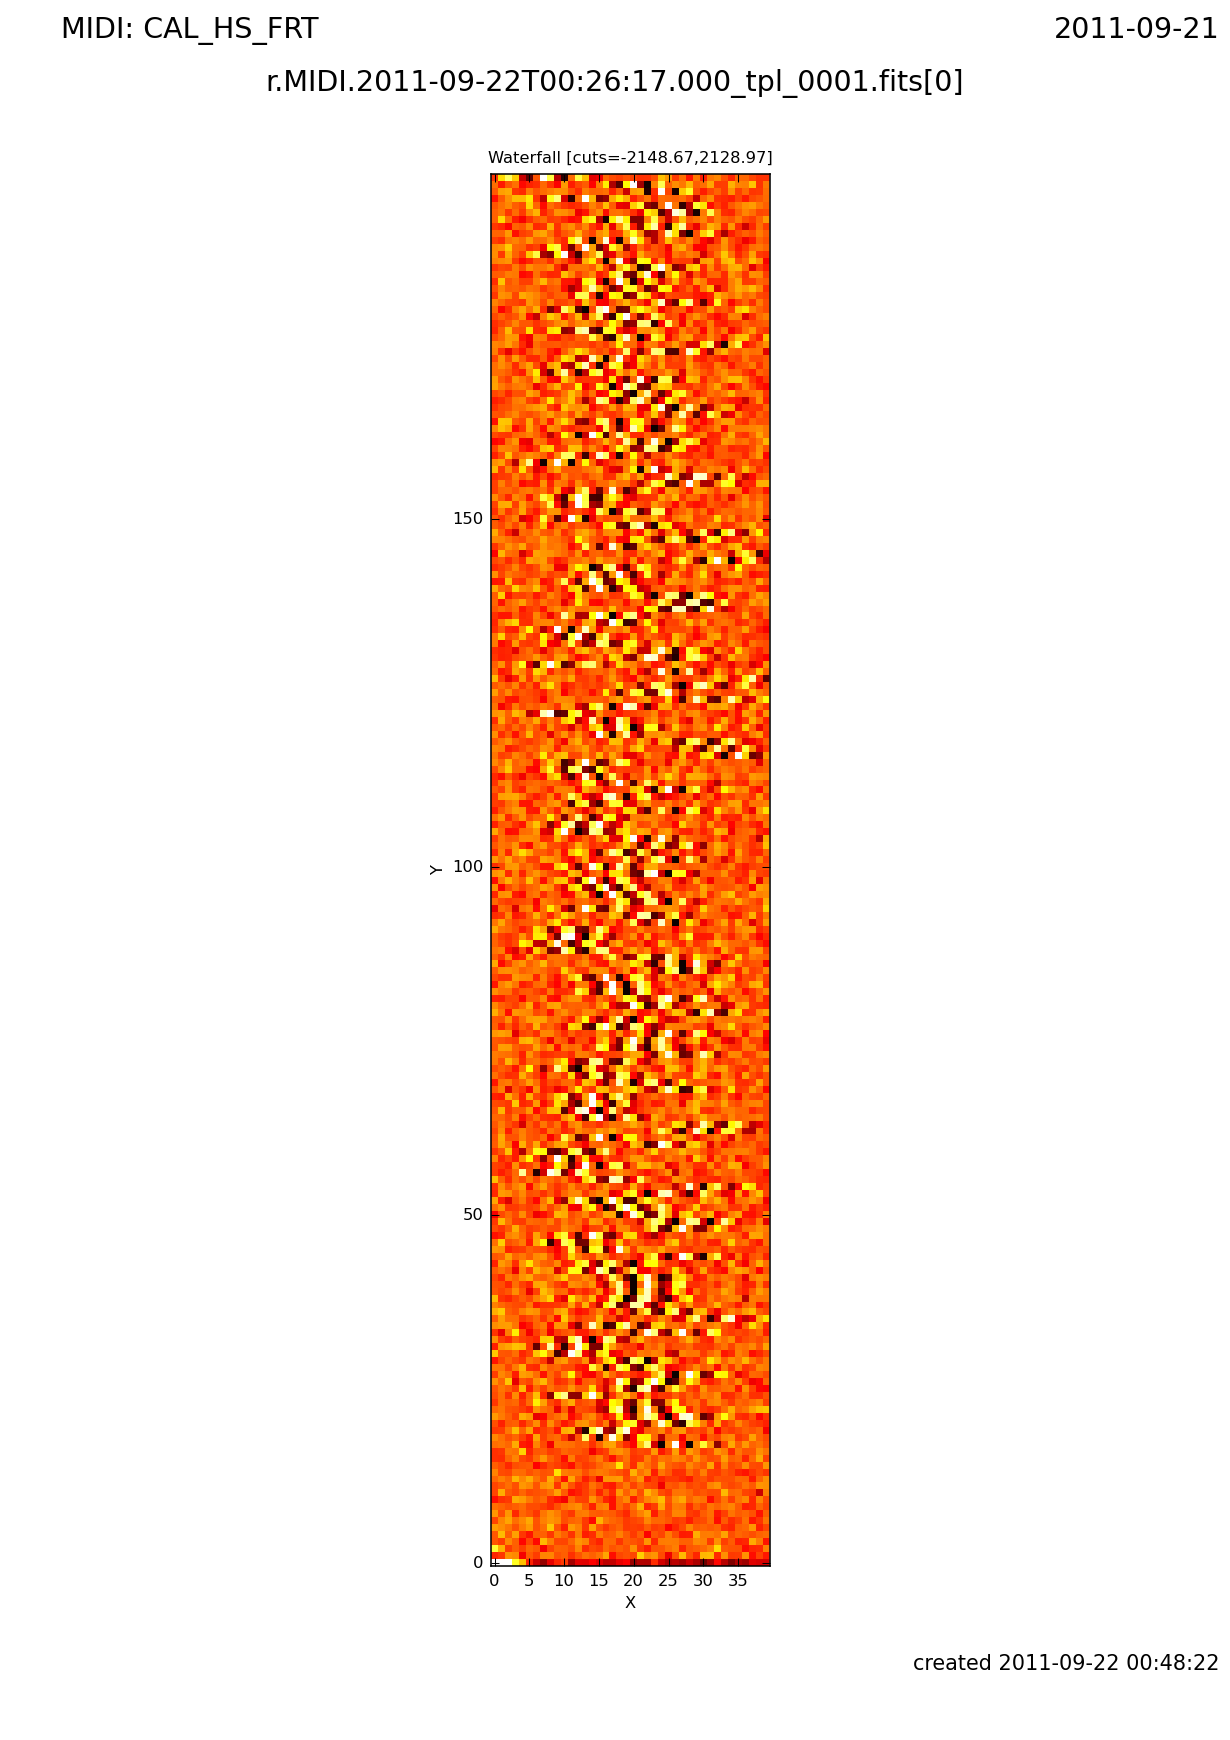
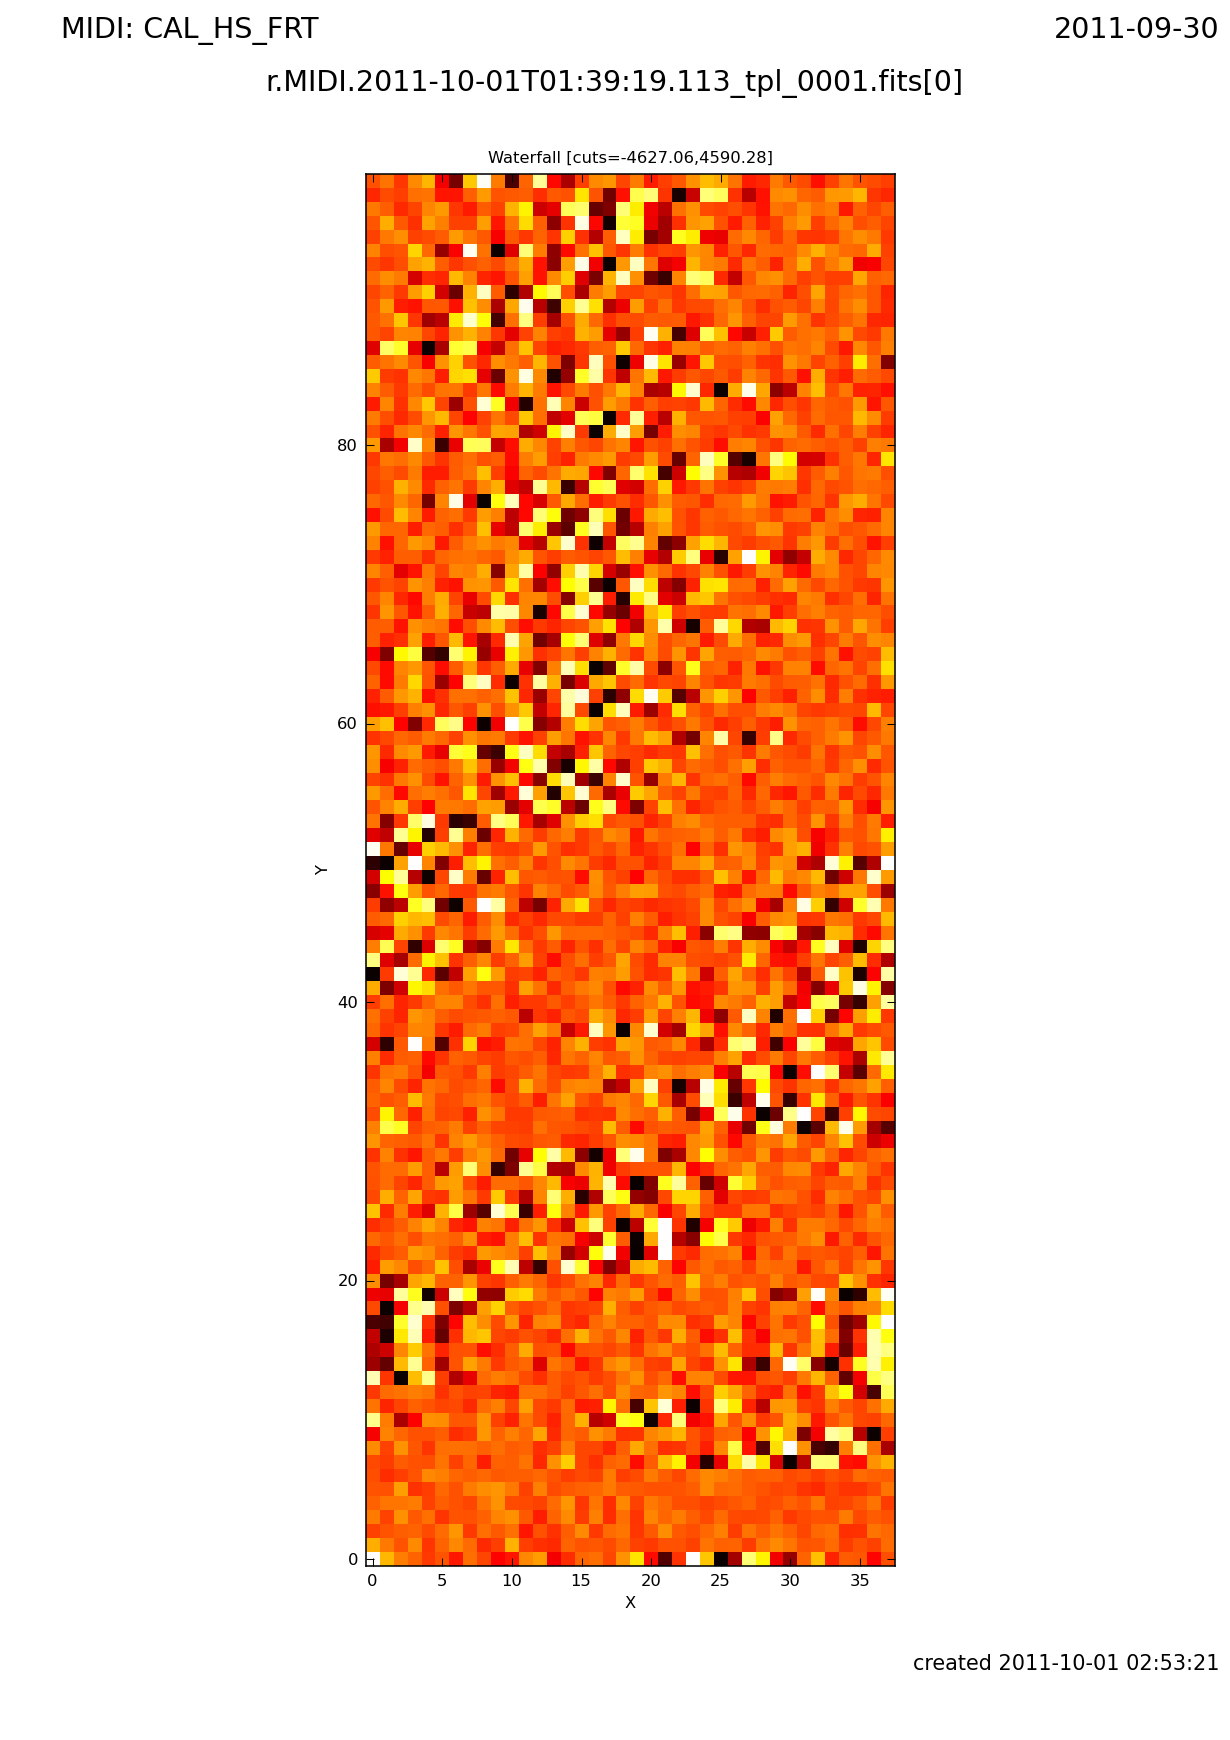
acq.png Acquisition frames (top row: field of view, bottom row: object) WF_HS.png waterfall display for HIGH_SENS data WF_SP.png waterfall display for SCI_PHOT data (fringes wandering across display are normal for SCI_PHOT) product_Vis.gif Dispersed Visibility (generated by extractVis_dispersed and plot_data_dispersed) product_TF.gif Dispersed Transfer_Function (generated by extractTF_dispersed and plot_data_dispersed) plot_HIGH_SENS.gif Main QC1 plot for HIGH_SENS mode (generated by midi_frg_hs_disp_display.csh) plot_SCI_PHOT.gif Main QC1 plot for SCI_PHOT mode (generated by midi_frg_sp_disp_display.csh) | |||||||||||||||||||||||
| QC1PARAM | ||||||||||||||||||||||||
| ALGORITHM |
The Visibility and TF are plotted for the full spectrum (170 channels for PRISM and 260 for GRISM) | |||||||||||||||||||||||
| CERTIF |
(guidelines for acceptance/rejection): On the main QC1 plots and on the TF plots : The binned TF should be between 0.4 and 1 for bin2, bin3, bin4 and should be smooth accross the full spectrum. For most of the baseline the TF is around .6/.8 On the main QC1 plots and on the Vis plots : The Visibility should be smooth accross the spectrum for a calibrator and larger than .4. If is a science, larger than .075 On the main QC1 plots: The histogramm of the flux should not have any values bellow 0 The fluxes should be equivalent for Interferometry and Photometry | |||||||||||||||||||||||
| COMMENTS | This is the main routine to QC process the data (see the individual scripts) | |||||||||||||||||||||||
| top | [2012-06-20T09:37:04] created by qcDocu v1.1.2, a tqs tool | |||||||||||||||||||||||