| This documentation is intended both for QC scientists and SciOps astronomers (who may want to ignore the technical information displayed in grey). | |||||||||||||||||||||||||||||
|
|||||||||||||||||||||||||||||
|
|||||||||||||||||||||||||||||
| bottom plots | contact | |||||||||||||||||||||||||||||
| NAME | science.prg (MIDAS) | ||||||||||||||||||||||||||||
| VERSION |
1.0 -- copied from flat.prg 1.1 -- includes qc_procflag, qc_numsat (2008-04-02) 1.2 -- rewritten for use by IDPs (2014-10-02) | ||||||||||||||||||||||||||||
| SYNTAX | MIDAS | ||||||||||||||||||||||||||||
| CALL | processQC -a ab_name | ||||||||||||||||||||||||||||
| INSTRUMENT | GIRAFFE | ||||||||||||||||||||||||||||
| RAWTYPE | SCI_MED (SCI_IFU, SCI_ARG are also supported by the recipe but not operationally) | ||||||||||||||||||||||||||||
| PURPOSE | compares raw and product SCIENCE files for FLAMES_GIRAFFE quality assessment and certification; QC1 values are calculated, a QC1 plot is generated, spectral closeups are generated. The QC1 data are fed into the QC1 database. | ||||||||||||||||||||||||||||
| PROCINPUT |
raw and AB product files, analyzed: SCIENCE_RBNSPECTRA, SCIENCE_RBNERRORS, SCIENCE_EXTSPECTRA; plus SCIENCE_RCSPECTRA for Argus and IFU1/2 also used: FF_LOCCENTROID from FFLAT for comparison of localisation DISP_SOLUTION for resolution and delta_T | ||||||||||||||||||||||||||||
| QC1TABLE |
trending | table(s) in QC1 database: giraffe_science | ||||||||||||||||||||||||||||
| TRENDPLOT | trending | HealthCheck plot associated to this procedure: none | ||||||||||||||||||||||||||||
| QC1PAGE | trending | associated documentation: none | ||||||||||||||||||||||||||||
| QC1PLOTS top |
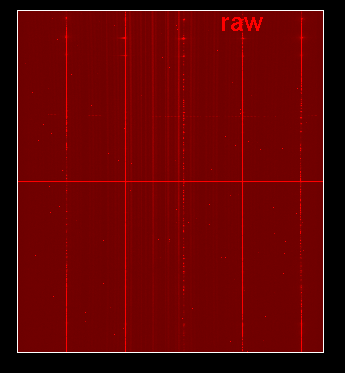
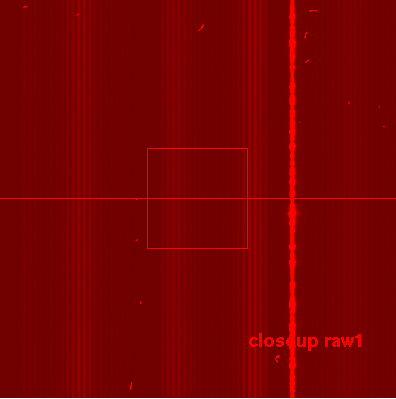
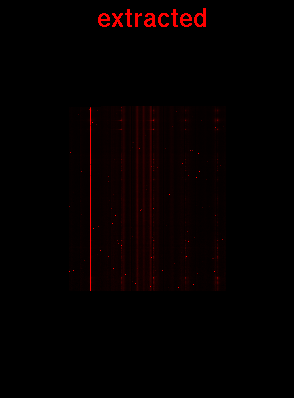
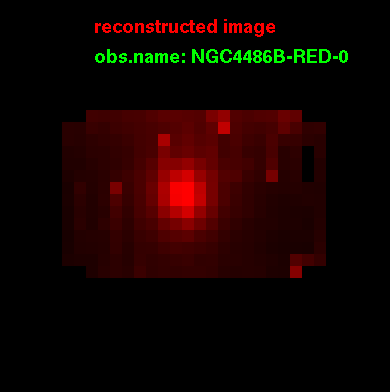
science1.gif box1: crosscut (middle row) through the raw file box2: similar crosscut, magnified Y scale (around BIAS level) box3: SNR vs. signal diagram, with the current value highlighted in red (it should fall onto a square-root curve composed of all other available values for the same setup) box4a: closeup of sky spectrum (assumed to be the faintest one, based on OzPoz table); with emission lines marked (in the red only) box4b: closeup of brightest object spectrum (based on OzPoz table), with telluric lines marked (in the red only); if no brightness information available, or for IFU1/2/Argus: always fibre #10 box4c: corresponding SNR sci_med2.gif [only for Medusa1/2] spectral closeups: each single fibre spectrum is displayed, with target names and magnitudes as read from the user-provided OzPoz table. These plots are available for Medusa1/2 only. There are three in total, covering fibres 1-135. science_2.png full display of raw frame (horizontal line: middle row; vertical lines if visible: SIMCAL fibre signal) science_3.png closeup of raw frame (if used: one SIMCAL fibre should be visible) science_4.png display of extracted and rebinned spectra (will show cosmics and SIMCAL fibre if used; if there are emission lines, they should display as nice horizontal row) sci_arg_5.png [Argus only] reconstructed image with target name sci_arg_6.png [Argus, IFU1/2] fibre tracing plots (there are actually 4), with SKY fibres in blue and SIMCAL fibres marked green; the tracings are base don the localization solution (based on NFLT or FFLAT) and should be compared to the actual signal sci_med3.png [Medusa1/2] fiibre tracing plots (there are actually 2), with SIMCAL fibres marked green; unused fibres are marked as blue bullet, not allocatable fibres by a cross-circle; the tracings are base don the localization solution (based on FLAT) and should be compared to the actual signal | ||||||||||||||||||||||||||||
| QC1PARAM |
QC1 parameters written into QC1 table: QC1_db names: brightest_fibre | brightest_object | brightest_flux | brightest_s2n (these parameters refer to the signal in the brightest fibre, as read from the ozpoz table if provided by the PI) qc_deltatemp | qc_deltatime (these parameters refer to the temperature difference INS.TEMP53.VAL between science and DISP_SOLUTION products, and the corresponding time difference) qc_resolmed (from DISP_SOLUTION) | qc_numsat | qc_median_data FITS key names: most of these parameters are calculated by the procedure, they are not available in the header. | ||||||||||||||||||||||||||||
| ALGORITHM |
The 'brightest' parameters are evaluated for Medusa mode only. They are found by evaluating the user-provided OzPoz table (columns 'OBJECT' and 'MAGNITUDE'), assuming that 'MAGNITUDE' comes in mags. The 'qc_deltatemp' parameter is calculated as difference between T53_SCI and T53_CAL (PDIS product derived from ARC calibration); qc_deltatime in a similar way from MJD-OBS. | ||||||||||||||||||||||||||||
| CERTIF |
Reasons for rejection: Usually science products are not rejected since the intrinsic quality (compliance with constraints) is checked on the mountain, and QC does not have enough information. Possible exceptions are: - complete or partial saturation - wrong classification (e.g. these are test data) - OB comments saying "this is a test exposure" - file is corrupt (e.g. extensions missing) etc. | ||||||||||||||||||||||||||||
| COMMENTS |
Scoring: qc_deltatemp | qc_deltatime | qc_median_data | qc_numsat; scoring for science data is used as an alert mechanism, yellow or red scores need an individual assessment. Typical cases of yellow/red scores: partially saturated pixels of SIMCAL emission lines in the red; alerts about deltatemp or deltatime (then you need to individually check whether this results in a serious mismatch between science and FLAT/ARC calibrations calls shell scirpt get_science_qc1_values to get S/N comparison data from qc1_db | ||||||||||||||||||||||||||||
| top | [2016-11-07T11:51:15] created by qcDocu v1.1.2, a tqs tool | ||||||||||||||||||||||||||||