| This documentation is intended both for QC scientists and SciOps astronomers (who may want to ignore the technical information displayed in grey). | ||||||||||||||||||||||||||||
|
||||||||||||||||||||||||||||
|
||||||||||||||||||||||||||||
| bottom plots | contact | ||||||||||||||||||||||||||||
| NAME | nflt.prg | |||||||||||||||||||||||||||
| VERSION |
1.0 -- spawned off flat.prg (2003-11) 1.1 -- have more detailed fibre plot (2003-11-24) 1.2 -- include image construction (2003-12-11) 1.3 -- have efficiency rms and reference files (2003-12-22) 1.4 -- have ORDER and SETTING (2004-04-27) 1.5 -- include scoreQC (2008-03-24) 1.5.1- includes qc_numsat (2009-06-17) | |||||||||||||||||||||||||||
| SYNTAX | MIDAS | |||||||||||||||||||||||||||
| CALL |
processQC -a abname; or: from $DFS_PRODUCT/NFLT/$DATE) inmidas -P -j "@@ $DFO_PROC_DIR/nflt.prg $date $primfile Y" (the last parameter Y/N controls creation of graphics on the screen) | |||||||||||||||||||||||||||
| INSTRUMENT | GIRAFFE | |||||||||||||||||||||||||||
| RAWTYPE | NFLAT: nasmyth flats (IFU1/2; Argus; no support for Medusa!); set of N files, usually N=3 | |||||||||||||||||||||||||||
| PURPOSE |
compares raw and product NASMYTH_FLAT files
for FLAMES_GIRAFFE QC assessment;
QC1 values are calculated, a QC1 plot is generated,
displays are generated. The QC1 data are fed into the
QC1 database. Most functions are identical to FFLAT/flat.prg. | |||||||||||||||||||||||||||
| PROCINPUT |
first raw NASMYTH_FLAT; products analyzed: NF_LOCWIDTH, NF_LOCCENTROID, NF_EXTSPECTRA, NF_EXTERROR, MASTER_NASMYTH_FLAT where NF stands for nasmyth flat. The nasmyth flats are usually obtained as attached calibrations, after the standard star, and do not come predictably. Therefore their quality cannot be checked as deeply as for fibre flats. | |||||||||||||||||||||||||||
| QC1TABLE |
trending | table(s) in QC1 database: giraffe_flat | |||||||||||||||||||||||||||
| TRENDPLOT |
trending | HealthCheck plot(s) associated to this procedure: trend_report_NASLAMP_HC.html | |||||||||||||||||||||||||||
| QC1PAGE |
trending | associated documentation: lamp_qc1.html#nasmyth | |||||||||||||||||||||||||||
| QC1PLOTS top |
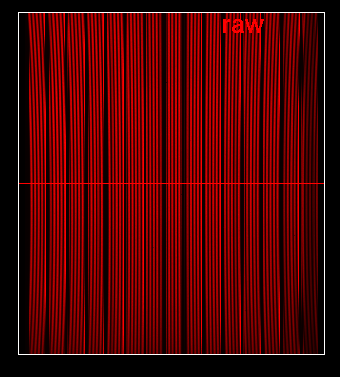
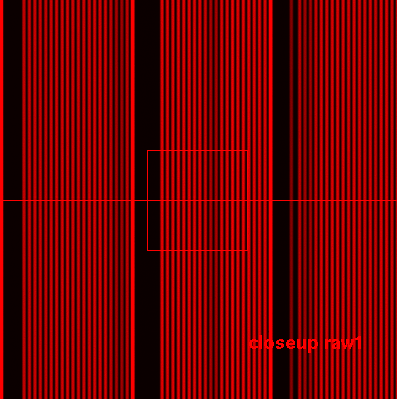
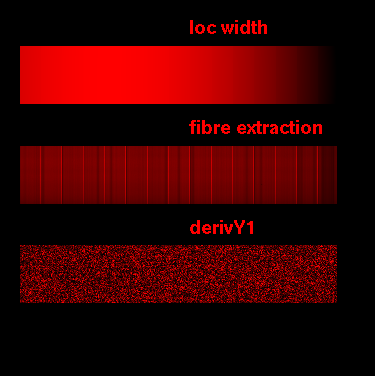
nflat1.gif box1:middle row in first raw (shows the fibre pattern; note the even illumination); box2:closeup of box1 (X950-1050); Gaussian shape of fibre signal (X direction = cross-dispersion); box3:visualization of NF_LOCWIDTH (top) and NF_LOCCENTROID (bottom) over fibre index; these are the Y-averaged width and centroid positions of each found fibre. All width values should form a nice parabola, with small variation of the average width (broken line); outliers indicate a missing fibre or a bad localization solution! All centroid points should form a nice straight line, with outliers indicating sky and simcal fibres; any other outlier indicates a missing fibre or a bad localization solution! box3 is very sensitive to missing fibres (the ones not specified in the recipe cal l). box4: histogram of 1st raw (black) and master (red); should drop to zero well below 65000 ADU (saturation check) box5: closeup of box4 around the saturation limit box6: mean of extracted fibres: Y-collapsed FF_EXTSPECTRA, should show scatter around 1 and be higher than 1 only for SKY or SIMCAL fibres box7: X-collapsed fibre efficiency for: fibre #1, #10, all fibres averaged (black) top panel: name of analyzed product NF_EXTSPECTRA bottom panel: file and QC1 parameters (exptime, nfib, mean_width, rms_width, mean_xrms, mean_xdiff, med_fib, num_out, mean_raw) scoring: num_fib, num_out, mean_width, rms_width, flux, qc_numsat are scored (marked yellow if found to deviate from trend) nflt2.png full display of raw frame (box: area displayed in nflt3.png) (same as in flat.prg) nflt3.png closeup of raw frame (box: area displayed in the graphical plot as box 2) (same as in flat.prg) nflt4.png display of products (top to bottom: location width, fibre extraction, derivY1 where derivY1 is the derivative in Y direction with 1 px offset) (same as in flat.prg) nflt5.png reconstructed image (each fibre collapsed, its mean value displayed in X and Y); this plot is useful to check for illumination problems nflt6.png fibre tracing plots (there are actually 2 for Medusa, and 4 for IFU/Argus) (same as in flat.prg). They display the raw signal with the NF_LOCCENTROID results overplotted. They also read the fibre and ozpoz binary tables (attached as extensions to the raw files) to know about SIMCAL and SKY fibres, as well about allocated fibres. All these types are marked in these plots. They are useful as sensitive control plots for proper fibre extraction and location. Any plotted tracing is used for signal extraction downstream. | |||||||||||||||||||||||||||
| QC1PARAM |
QC1 parameters written into QC1 table: QC1_db names: same as for flat.prg FITS key names: same as for flat.prg QC1 params created by pipeline: most | |||||||||||||||||||||||||||
| ALGORITHM |
Description of algorithms: see http://www.eso.org/observing/dfo/quality/GIRAFFE/qc/lamp_qc1.html | |||||||||||||||||||||||||||
| CERTIF |
Reasons for rejection: - scoring alerts, in particular saturation - unusual patterns in flat1.gif, box 3 - unusual patterns in flat4.png, deviations of tracing and signal in flat5.png - these are sometimes due to a missing (broken) fibre; then the input parameter set for that specific fibre set (slit) needs to be adapted; sometimes very steep flux gradients can prevent proper localization. Sometimes Medusa1/2 attached nasmyth flats are taken. They usually have a very special fibre setup (the one used for science) and either fail upon processing, or the products have a bad quality and need to be rejected. | |||||||||||||||||||||||||||
| COMMENTS |
Scoring: num_fib, num_out, mean_width, rms_width, flux (this for HC settings only) NFLATs have a better illumination pattern than FFLATs, visible in box1 of nflat1.gif. All pipeline-provided QC1 parameters are documented in the pipeline users manual (as of issue 2, 2007-12-28) mean_effic has been added in 2008 (QC.MEAN.EFFIC) since it comes in opslog files; but not used in HC plot since otherwise HISTORY would be lost | |||||||||||||||||||||||||||
| top | [2015-10-29T10:06:25] created by qcDocu v1.1.2, a tqs tool | |||||||||||||||||||||||||||