| This documentation is intended both for QC scientists and SciOps astronomers (who may want to ignore the technical information displayed in grey). | |||||||||||||||||||||||||||||
|
|||||||||||||||||||||||||||||
|
|||||||||||||||||||||||||||||
| bottom plots | contact | |||||||||||||||||||||||||||||
| NAME | simlamp.prg | ||||||||||||||||||||||||||||
| VERSION | 1.0 -- GIRAFFE (September 2003) 1.1 -- construct PIPEFILE entry (2007-02-07) | ||||||||||||||||||||||||||||
| SYNTAX | MIDAS | ||||||||||||||||||||||||||||
| CALL |
processQC -a abname; or: from $DFS_PRODUCT/SIMLAMP/$DATE inmidas -P -j "@@ $DFO_PROC_DIR/simlamp.prg $date $primfile" | ||||||||||||||||||||||||||||
| INSTRUMENT | GIRAFFE | ||||||||||||||||||||||||||||
| RAWTYPE | SIMLAMP (single file) | ||||||||||||||||||||||||||||
| PURPOSE | compares raw and reference SIMLAMP,TAL files taken for stability tests; QC1 values are calculated, a QC1 plot is generated, displays are generated. The QC1 data are fed into the QC1 database. | ||||||||||||||||||||||||||||
| PROCINPUT | single raw (!) SIMLAMP file, no products available. | ||||||||||||||||||||||||||||
| QC1TABLE |
trending | table(s) in QC1 database: giraffe_simlamp | ||||||||||||||||||||||||||||
| TRENDPLOT |
trending | HealthCheck plot(s) associated to this procedure: trend_report_STABILITY_HC.html | trend_report_SIMLAMP_HC.html | ||||||||||||||||||||||||||||
| QC1PAGE |
trending | associated documentation: fmt_qc1.html | lamp_qc1.html | ||||||||||||||||||||||||||||
| QC1PLOTS top |
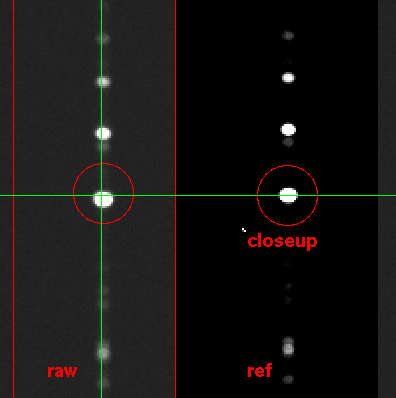
simlamp1.gif box1: averaged rows in raw frame (shows five peaks: the SIMCAL fibres); box2a: closeup of box1 (X900-1100) box2b: closeup of averaged columns (Y2050-2150) box3a: X correlation against reference file (detects X shift of grating) box3b: Y correlation against reference file (detects Y shift of grating) bottom: X and Y shifts; detected flux in ADU/sec simlamp2.png screenshot of input raw frame, with red markings. Vertical lines mark the range of the middle SIMCAL fibre signal as used for correlation, horizontal lines mark the range with the emission line used for the flux monitoring. simlamp3.png closeup of simlamp2.png, with the emission lines of the central square defined there and the similar region in the reference file, plus the emission line used for the flux parameter and marked by the red circle | ||||||||||||||||||||||||||||
| QC1PARAM |
QC1 parameters written into QC1 table: QC1_db names: mean_xdiff | mean_ydiff | ins_temp53_val (for T correlation) | flux (for lamp monitoring) FITS key names: there is no pipeline recipe. Only TEMP53 is read from the header. | ||||||||||||||||||||||||||||
| ALGORITHM |
Description of algorithms: see here | ||||||||||||||||||||||||||||
| CERTIF | Reasons for rejection: since there are no products, there is nothing to reject. This is purely a HC procedure, to detect flux problems and problems with non-thermal shifts of the grating in X or Y. | ||||||||||||||||||||||||||||
| COMMENTS |
Scoring: ins_temp53_val | mean_xdiff | mean_ydiff | flux All except for ins_temp53_val are calculated by this procedure. | ||||||||||||||||||||||||||||
| top | [2017-12-27T14:52:03] created by qcDocu v1.1.2, a tqs tool | ||||||||||||||||||||||||||||