| This documentation is intended both for QC scientists and SciOps astronomers (who may want to ignore the technical information displayed in grey). | |||||||||||||||||||||||||||||
|
|||||||||||||||||||||||||||||
|
|||||||||||||||||||||||||||||
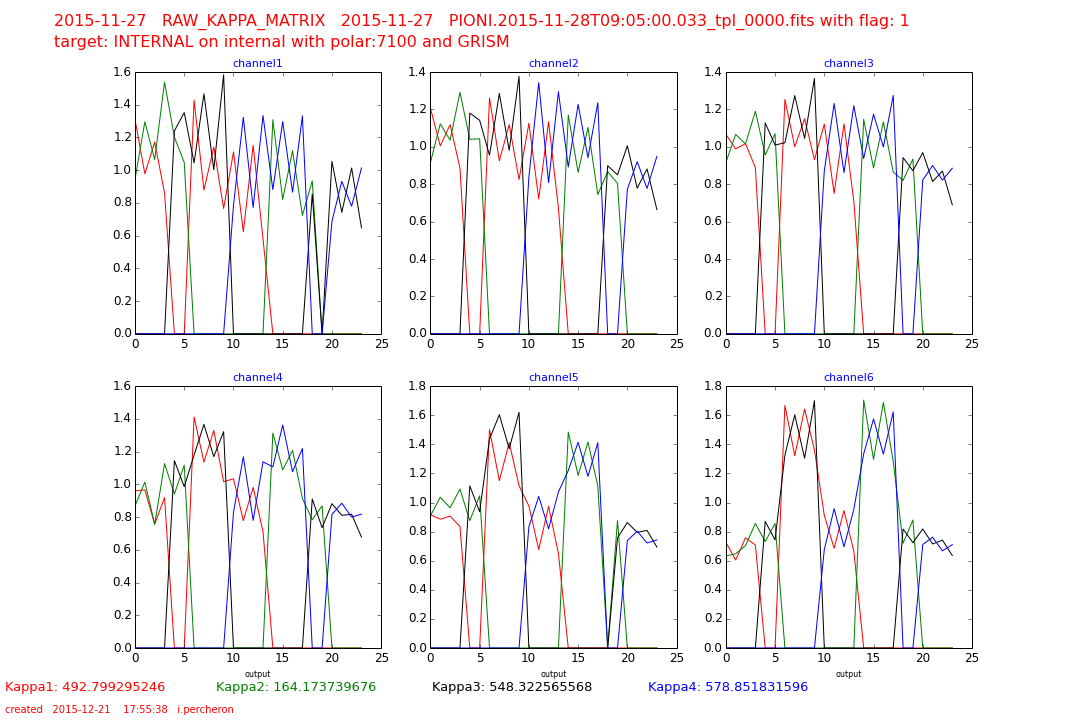
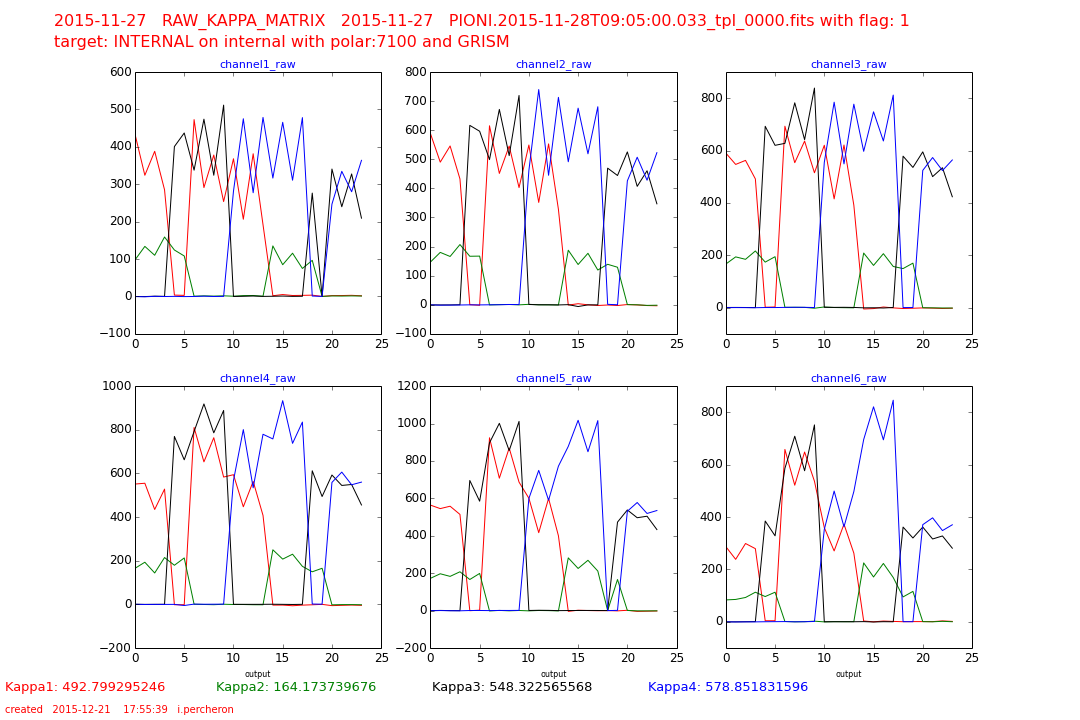
| bottom plots | contact | |||||||||||||||||||||||||||||
| NAME | pionier_speccalQC.py | ||||||||||||||||||||||||||||
| VERSION |
1.0 -- 2015-06-06 | ||||||||||||||||||||||||||||
| SYNTAX | PYTHON | ||||||||||||||||||||||||||||
| CALL |
measureQuality from $DFS_PRODUCT/SPECTRAL_CALIBRATION/$DATE: pionier_speccalQC.py -a $AB | ||||||||||||||||||||||||||||
| INSTRUMENT | PIONIER | ||||||||||||||||||||||||||||
| RAWTYPE | RAW_SPEC_CALIBRATION | ||||||||||||||||||||||||||||
| PURPOSE |
a) generates QC reports | ||||||||||||||||||||||||||||
| PROCINPUT |
No special input is required: a) $DATE is read from the input AB c) frames are implicitly read from the AB. | ||||||||||||||||||||||||||||
| QC1TABLE |
trending | table(s) in QC1 database: pionier_spec_calibration | ||||||||||||||||||||||||||||
| TRENDPLOT |
trending | HealthCheck plot(s) associated to this procedure: trend_report_SPECTRAL_CALIB_HC.html | ||||||||||||||||||||||||||||
| QC1PAGE |
trending | associated documentation: speccal_qc1.html | ||||||||||||||||||||||||||||
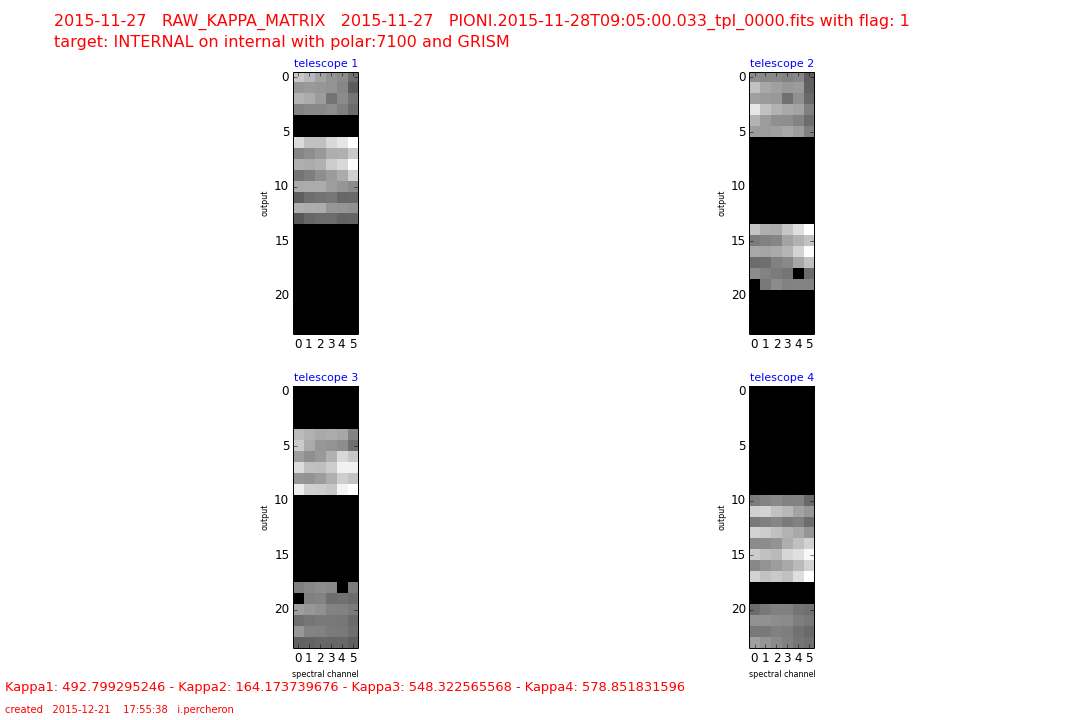
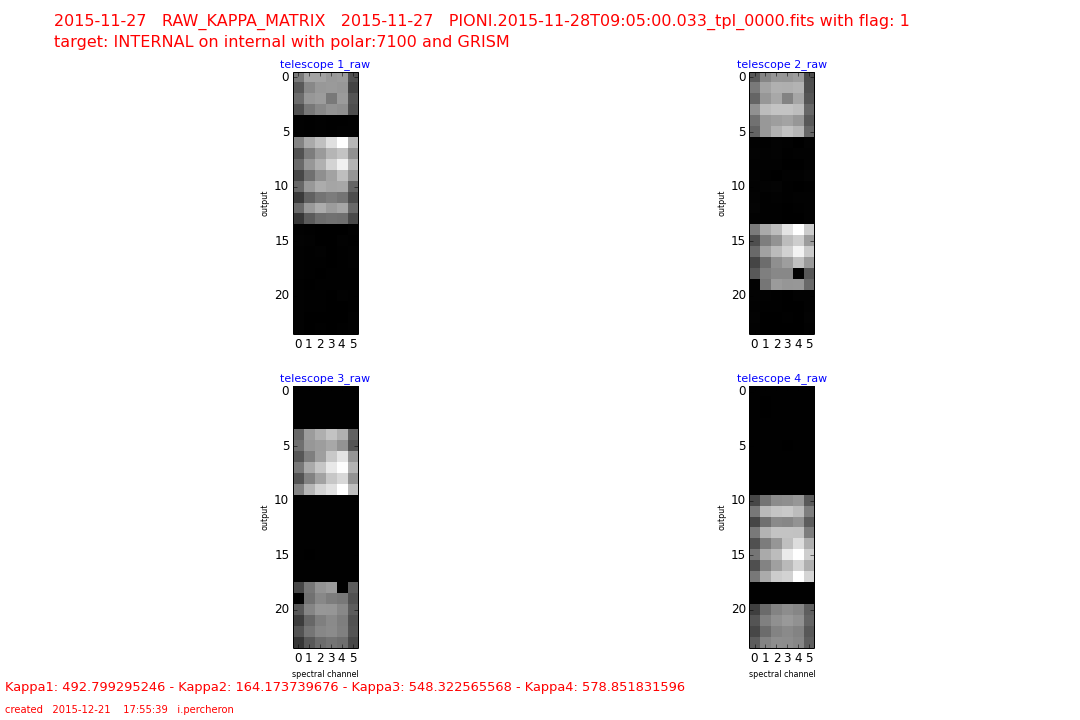
| QC1PLOTS top |
r.PIONI.2015-11-28T09:05:00.033_tpl_0000.png r.PIONI.2015-11-28T09:05:00.033_tpl_0001.png r.PIONI.2015-11-28T09:05:00.033_tpl_0002.png r.PIONI.2015-11-28T09:05:00.033_tpl_0003.png | ||||||||||||||||||||||||||||
| QC1PARAM |
QC1 parameters written into QC1 table :SOURCE(header/script) DBNAME value description | ||||||||||||||||||||||||||||
| ALGORITHM |
Description of algorithms: This measures the effective wavelength of each spectral channel by measuring the actual fringes spacing for long scans. This is only possible if the internal piezo scanner is well calibrated/known and linear Data can be taken on sky (used to calibrate sky data). or on the internal lamp (HC). using the Fourier Transform Spectrometry of the fringes | ||||||||||||||||||||||||||||
| CERTIF |
Products are rejected if the central wavelength is too far off Products are rejected if the effective band is too far off | ||||||||||||||||||||||||||||
| COMMENTS | None | ||||||||||||||||||||||||||||
| top | [2018-10-15T11:53:54] created by qcDocu v1.1.2, a tqs tool | ||||||||||||||||||||||||||||