Engineering Interfaces
Device Manager GUI
The Device Manager provides an engineering interface that enables an easy control and monitor of the devices managed by the server. Each device type has a dedicated widget and the list of widgets is built reading the configuration at startup. Devices can be controlled individually using the Setup button within each device widget or collectively using the Setup button at the bottom of the GUI.
Note
The menu FCS enables to control the main states of the server. The server can be also restarted from this menu.
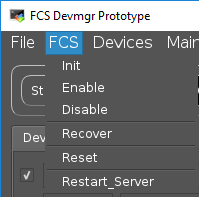
FCF menu.
Note
The menu Devices enables to control directly one or more device controllers running in the PLC. Devices can be either ignored or simulated as well from this menu.
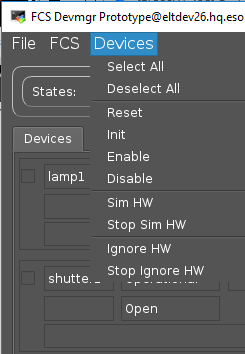
Devices menu.
At the bottom, a command window is included reporting the commands sent and the replies received by the GUI. In the case of Setup commands, the message payload is displayed in JSON format for human readability.

Command window widget.
The GUI does not prevent the execution of parallel Setup commands. This is achieved by creating a new thread per each command.
$ fcfgui
Options:
  -h [ --help ]          Print help messages
  -n [ --proc-name ] arg Process name
  -l [ --log-level ] arg Log level: ERROR, WARNING, STATE, EVENT, ACTION, INFO, DEBUG, TRACE
  -c [ --config ] arg    Configuration filename
  -d [ --db-host ] arg   In-memory DB host (ipaddr:port)
Warning
The configuration file must be the same one used by the Device Manager that you want to connect to.
An example how to start the fcfgui from the command line is shown
below.
$ fcfgui -c devmgr/server/cfg.yml
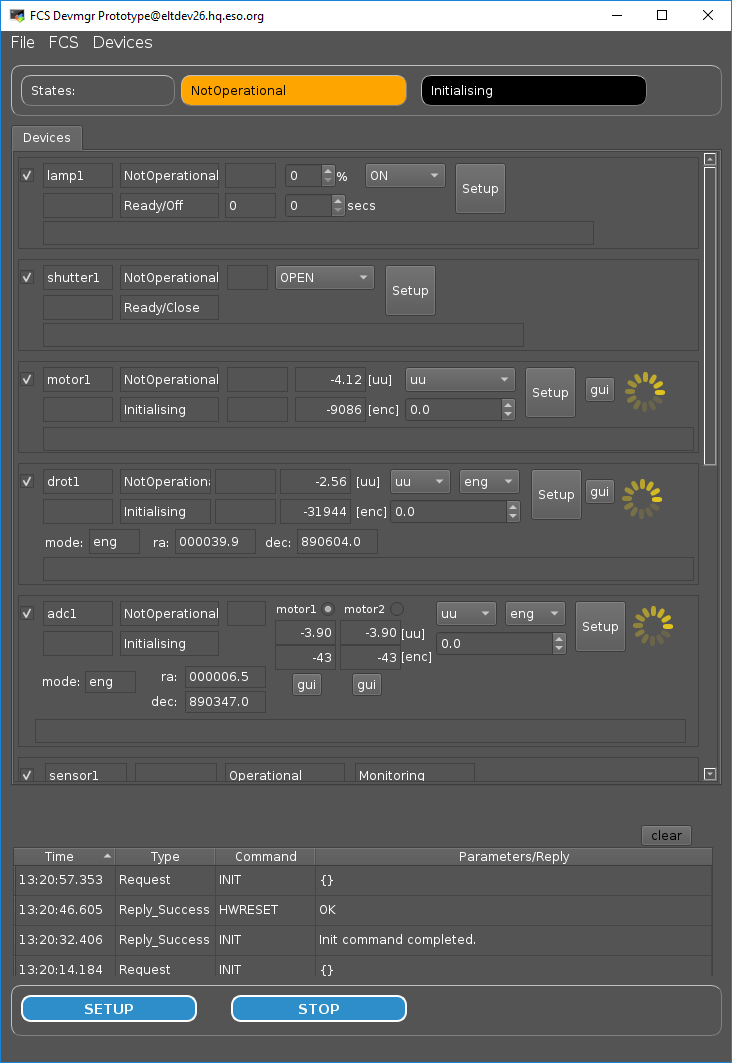
Device Manager Engineering Graphical Interface.
Motor Engineering GUI
The Motor device provides an additional engineering interface offering
more details for the control and monitoring of motorized devices
(pymotgui). With this GUI it is possible to see the motor position
or the activation of signals during initialisation. The motor can be
controlled in Position or in Velocity mode.
The pymotgui can be launched directly from the command line or
from each Motor widget by pressing the  button.
$ motgui
usage: pymotgui [-h] -d DEVICE -a ADDRESS -p PREFIX [-n NS]
            [-l {INFO,DEBUG,ERROR}]

optional arguments:
-h, --help            show this help message and exit
-d DEVICE, --device DEVICE
                    Set motor device.
-a ADDRESS, --address ADDRESS
                    Set PLC address, e.g. opc.tcp://134.171.59.98:4840
-p PREFIX, --prefix PREFIX
                    Set motor prefix, e.g. MAIN.Motor1
-n NS, --ns NS        Set OPCUA namespace, e.g. 4
- l {INFO,DEBUG,ERROR}, --loglevel {INFO,DEBUG,ERROR}
                    set the logging level: INFO|DEBUG|ERROR
An example how to start the pymotgui from the command line is
shown below.
$ pymotgui -d motor1 -a opc.tcp://127.0.0.1:7578 -p MAIN.Synchro2
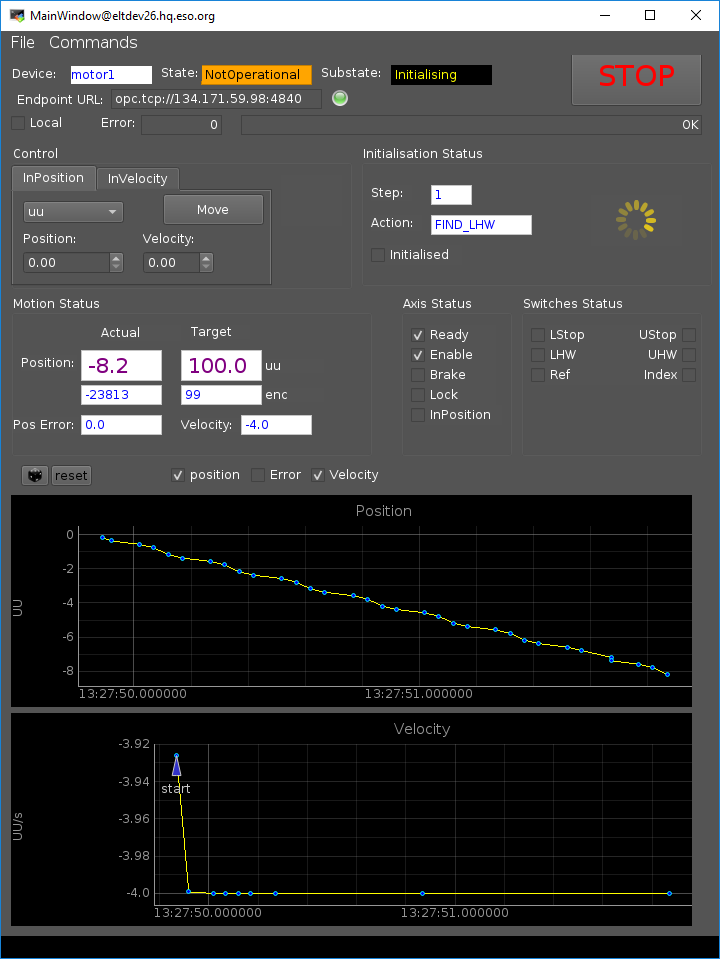
Motor Graphical Interface.
Initialisation Markers
The Motor GUI uses markers to identify the time when motors reach a switch during the initialisation sequence. Two markers indicate the start and the end of the sequence, the others will depend of the switches reached during the sequence, see an example in the image below. In this example it was marked lower and higher hardware limits.

Example of Initialisation Markers.
Exporting Plotting Data
The plotting data can be exported in a CSV format. This can be achieved by doing the following steps:
- Press mouse right-button and select “Export…”
- Select “CSV from plot data” and press “Export”, see image below.
- Define the name of the file, e.g. myplotdata.csv and press “Save”.
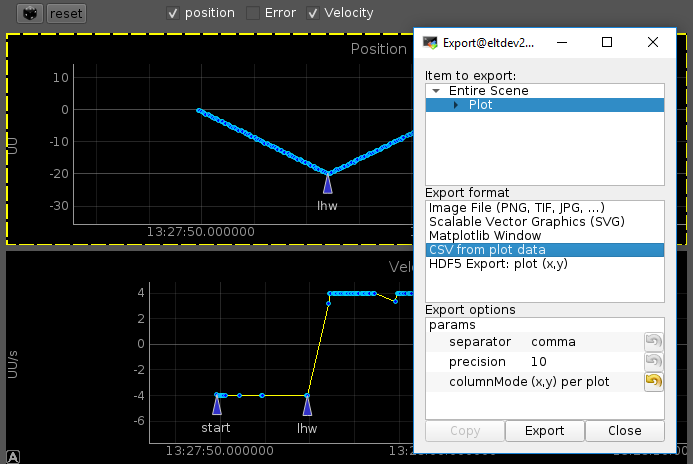
Exporting Plotting Data.
Warning
The marker information is not included in the exported data.