Velocities of 5634 southern galaxies
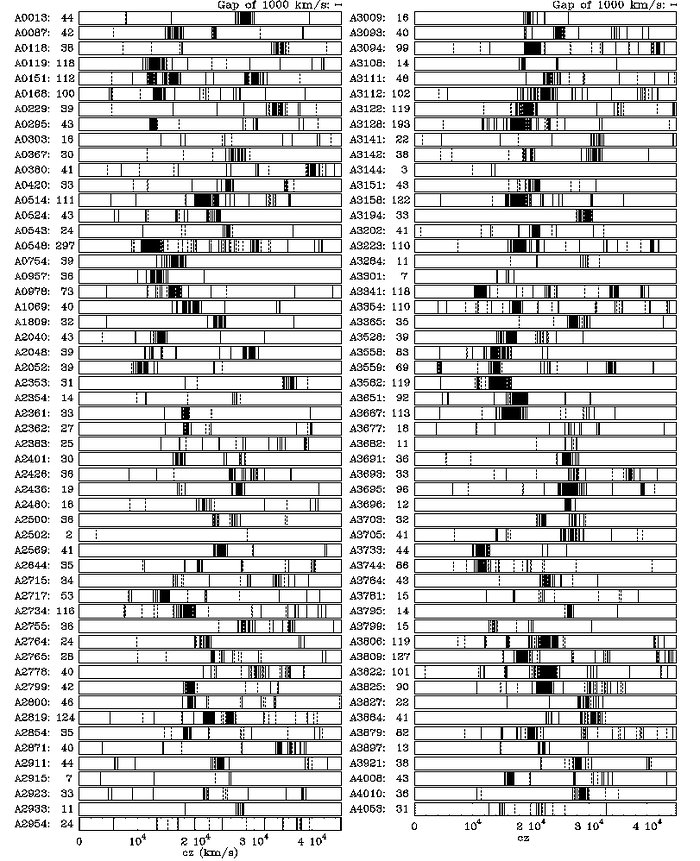
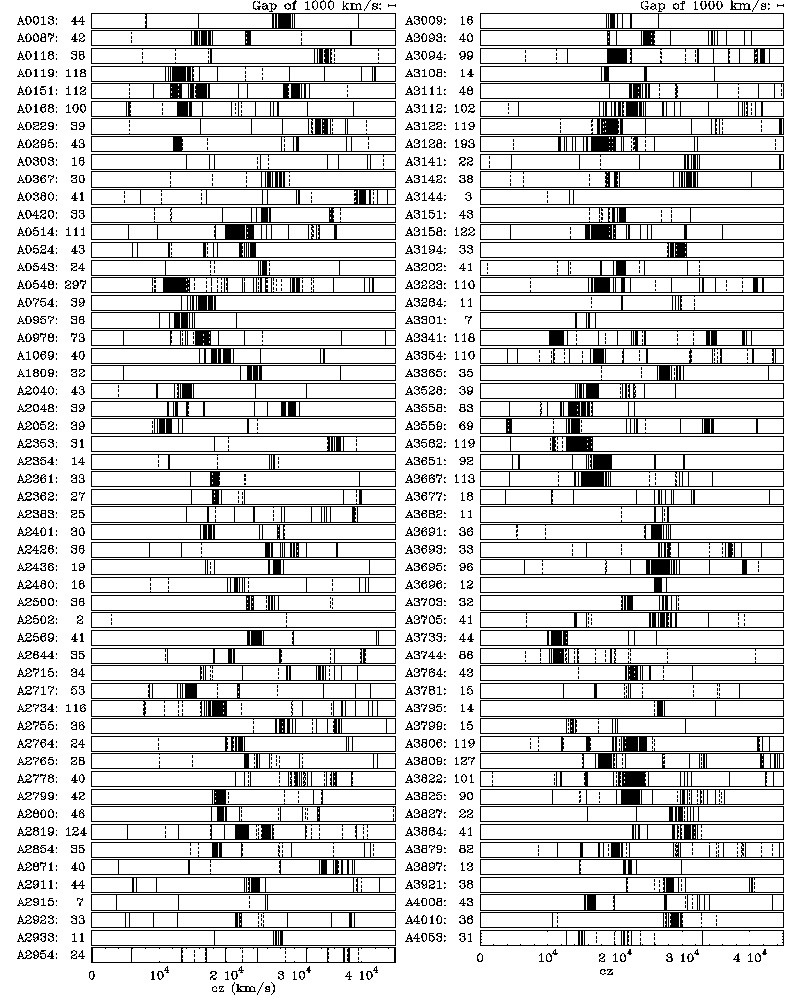
This diagramme gives an overview of the velocities of 5634 individual galaxies which were measured during the ESO Nearby Abell Cluster Survey (ENACS) in the directions of 107 rich and nearby Abell clusters. Each bar plot refers to an individual cluster, the designation of which is shown to the left, together with the total number of galaxy redshifts measured for the cluster.
Each vertical line represents one galaxy, and the position in the bar indicates the measured value of its velocity according to the scale at the bottom. Galaxies that show emission lines in their spectrum are indicated by dashed vertical lines; the others are fully drawn.
Rich Abell clusters appear as clumps of galaxies in which the individual velocities only differ as a result of the internal motions in the cluster, so that the galaxies are very close in the bar plots. Such highly clumped distributions are observed for the majority of the clusters studied here. This means that about that 90 percent of the rich nearby Abell clusters are real physical entities.
About three-quarters of the galaxies observed during ENACS reside in the dominant clump (the cluster); about half of the remaining one-quarter are found in small groups, and the last are in the space in between. The galaxies with emission lines in their spectra (the spiral galaxies) have a preference to be located in small groups or at the periphery of the rich clusters.
Since their average velocity is proportional to their distance, the distribution of the average velocities of the clumps in this diagramme also gives information about the spatial distribution of the clusters in the Universe.
Credit:ESO
About the Image
| Id: | eso9607b |
| Type: | Chart |
| Release date: | 9 February 1996 |
| Related releases: | eso9607 |
| Size: | 811 x 998 px |