| This documentation is intended both for QC scientists and SciOps astronomers (who may want to ignore the technical information displayed in grey). | ||||||||||||||||||||||||||||
|
||||||||||||||||||||||||||||
|
||||||||||||||||||||||||||||
| bottom plots | contact | ||||||||||||||||||||||||||||
| NAME | crires_wave.py | |||||||||||||||||||||||||||
| VERSION |
1.0 -- July 2008 1.0.1 -- check for file existence added in compare_model (2008-11-17) 1.0.2 -- changes for WAVE_SKY (2009-03-09) 1.1 -- usage of wrapper_options, set_logging, find_mcal (2009-04-03) 1.2 -- upgrade to numpy V1.3 and matplotlib V0.99 (2009-10-29/2009-11-25) 1.2.1 -- changes with respect to supporting windowed read-out (2010-04-28) 1.2.2 -- create cover sheet (2011-05-19) 1.2.3 -- skip call of scoreQC (2011-05-31) 1.2.4 -- tick marks changed for compare_model plot (2012-02-03) 1.2.5 -- print name of model configuration file (2012-02-14) 1.2.6 -- calculate total ThAr line flux (2012-04-03) 1.2.7 -- new QC parameters: num_overexp, level_overexp (2012-06-20) 1.2.8 -- ThAr line flux: usage of background from raw frame instead of master dark (2012-06-29) 1.2.9 -- ThAr line flux: individual extraction areas for each detector (2012-08-29) 1.2.10-- changes for crires-2.3.0: use wavecal solution from second fibre (2012-09-25) 1.2.11-- changes needed for migration to muc (2013-02-06) | |||||||||||||||||||||||||||
| SYNTAX | PYTHON | |||||||||||||||||||||||||||
| CALL |
processQC from $DFS_PRODUCT/DARK/$DATE /home/python/crires_wave.py -i -a $AB | |||||||||||||||||||||||||||
| INSTRUMENT | CRIRES | |||||||||||||||||||||||||||
| RAWTYPE | WAVE_LAMP | WAVE_ABS | |||||||||||||||||||||||||||
| PURPOSE | QC check of raw arc lamp and absorption cell exposures; check of wavelength solution | |||||||||||||||||||||||||||
| PROCINPUT | raw frame, wavelength solution table, wavelength maps | |||||||||||||||||||||||||||
| QC1TABLE |
trending | table(s) in QC1 database: crires_wave | |||||||||||||||||||||||||||
| TRENDPLOT |
trending | HealthCheck plot(s) associated to this procedure: trend_report_WAVEXCORR_HC.html | trend_report_WAVETHAR_HC.html | trend_report_WAVEN2O_HC.html | trend_report_WAVEDISP_HC.html | trend_report_WAVEAVG_HC.html | trend_report_LAMPTHAR_HC.html | |||||||||||||||||||||||||||
| QC1PAGE |
trending | associated documentation: wave_qc1.html | |||||||||||||||||||||||||||
| QC1PLOTS top |
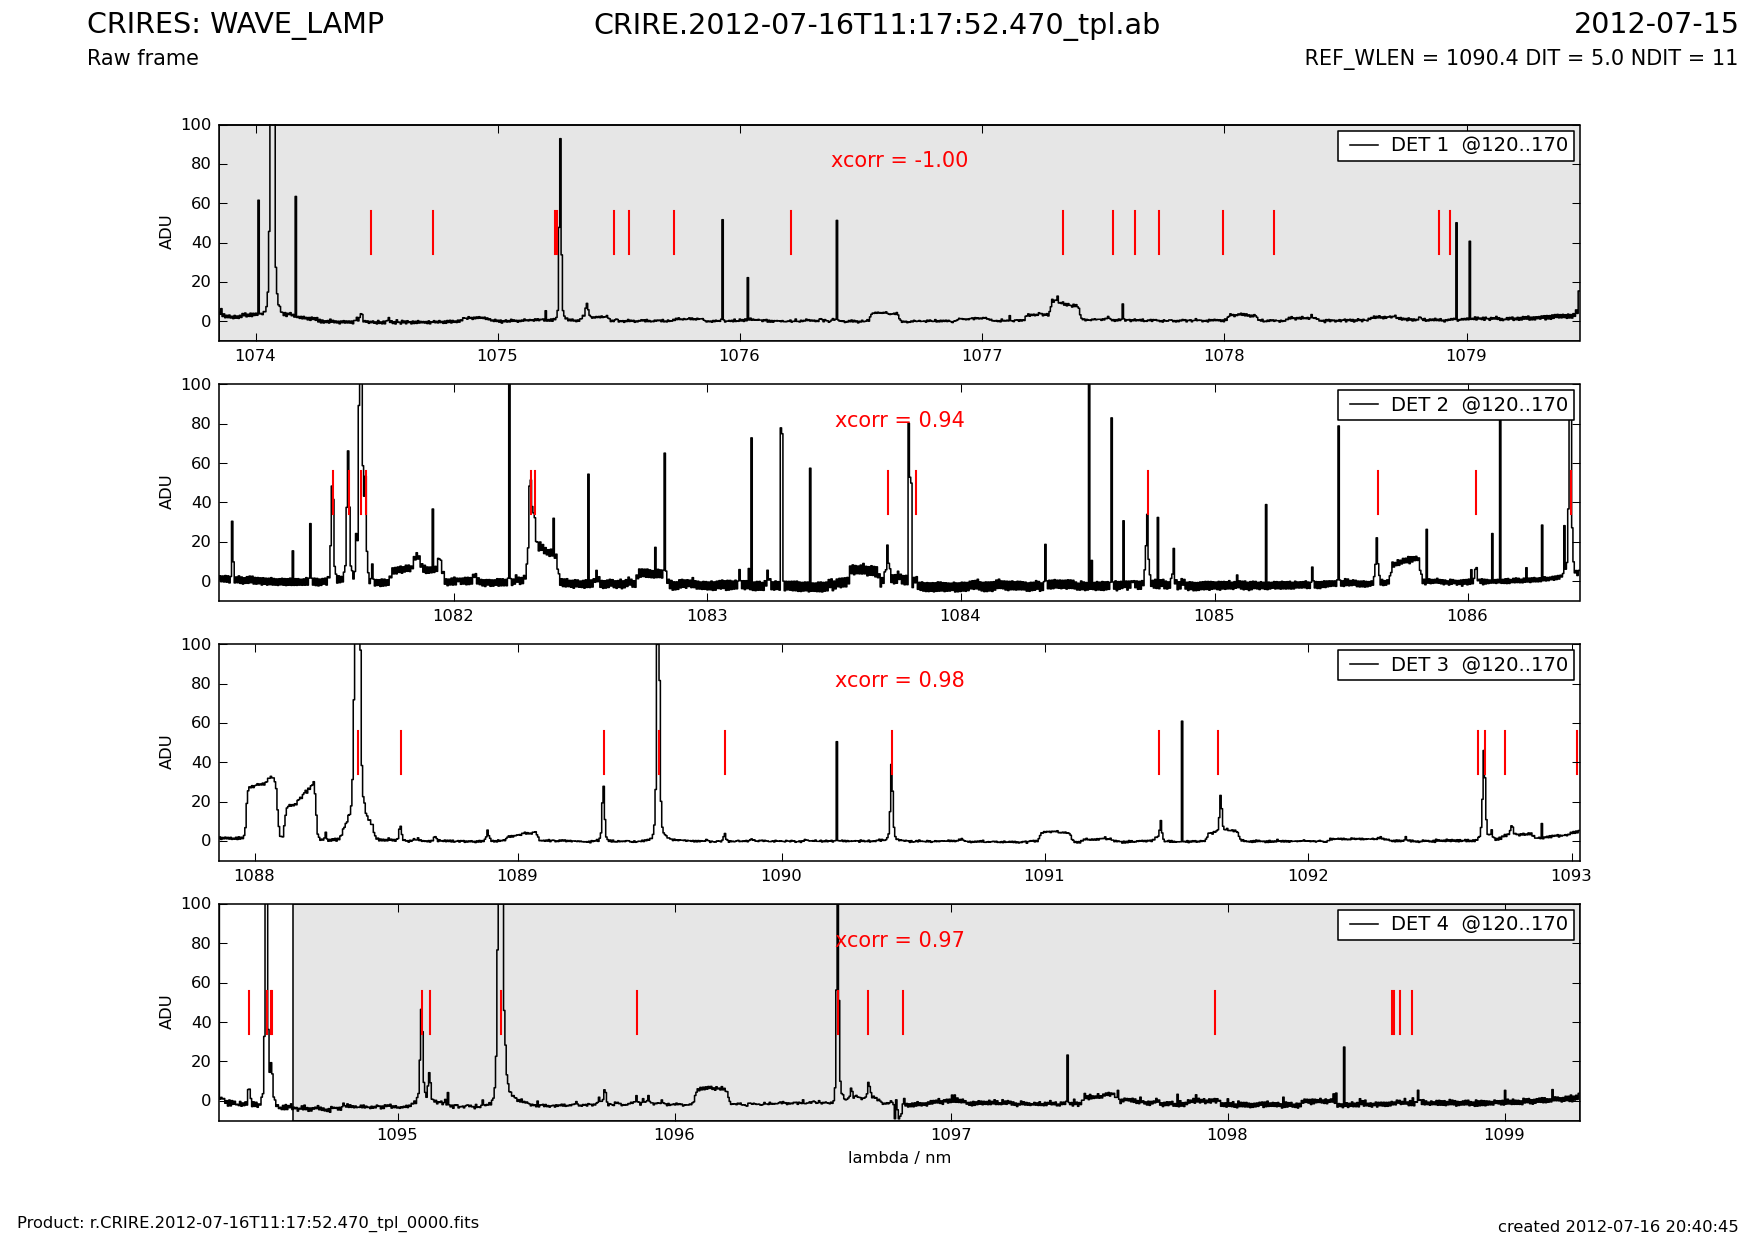
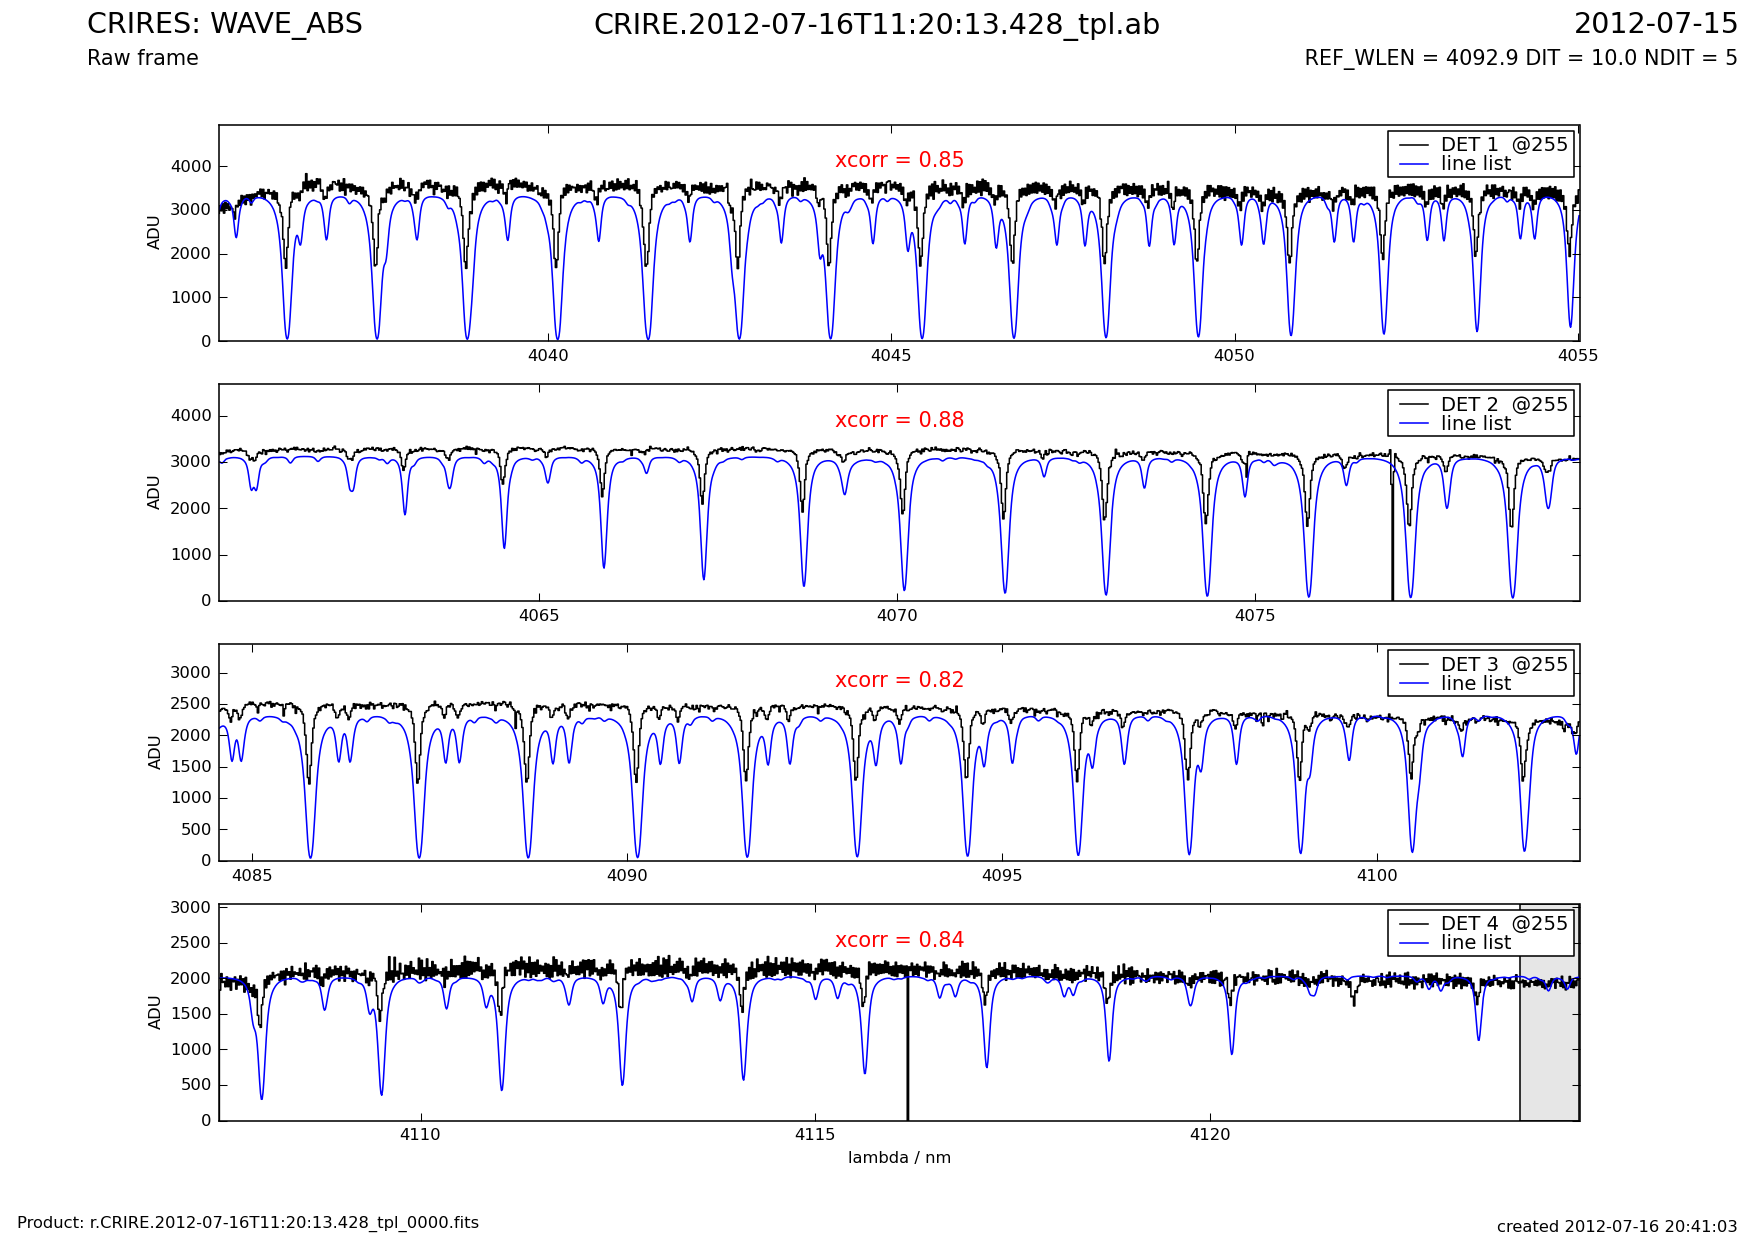
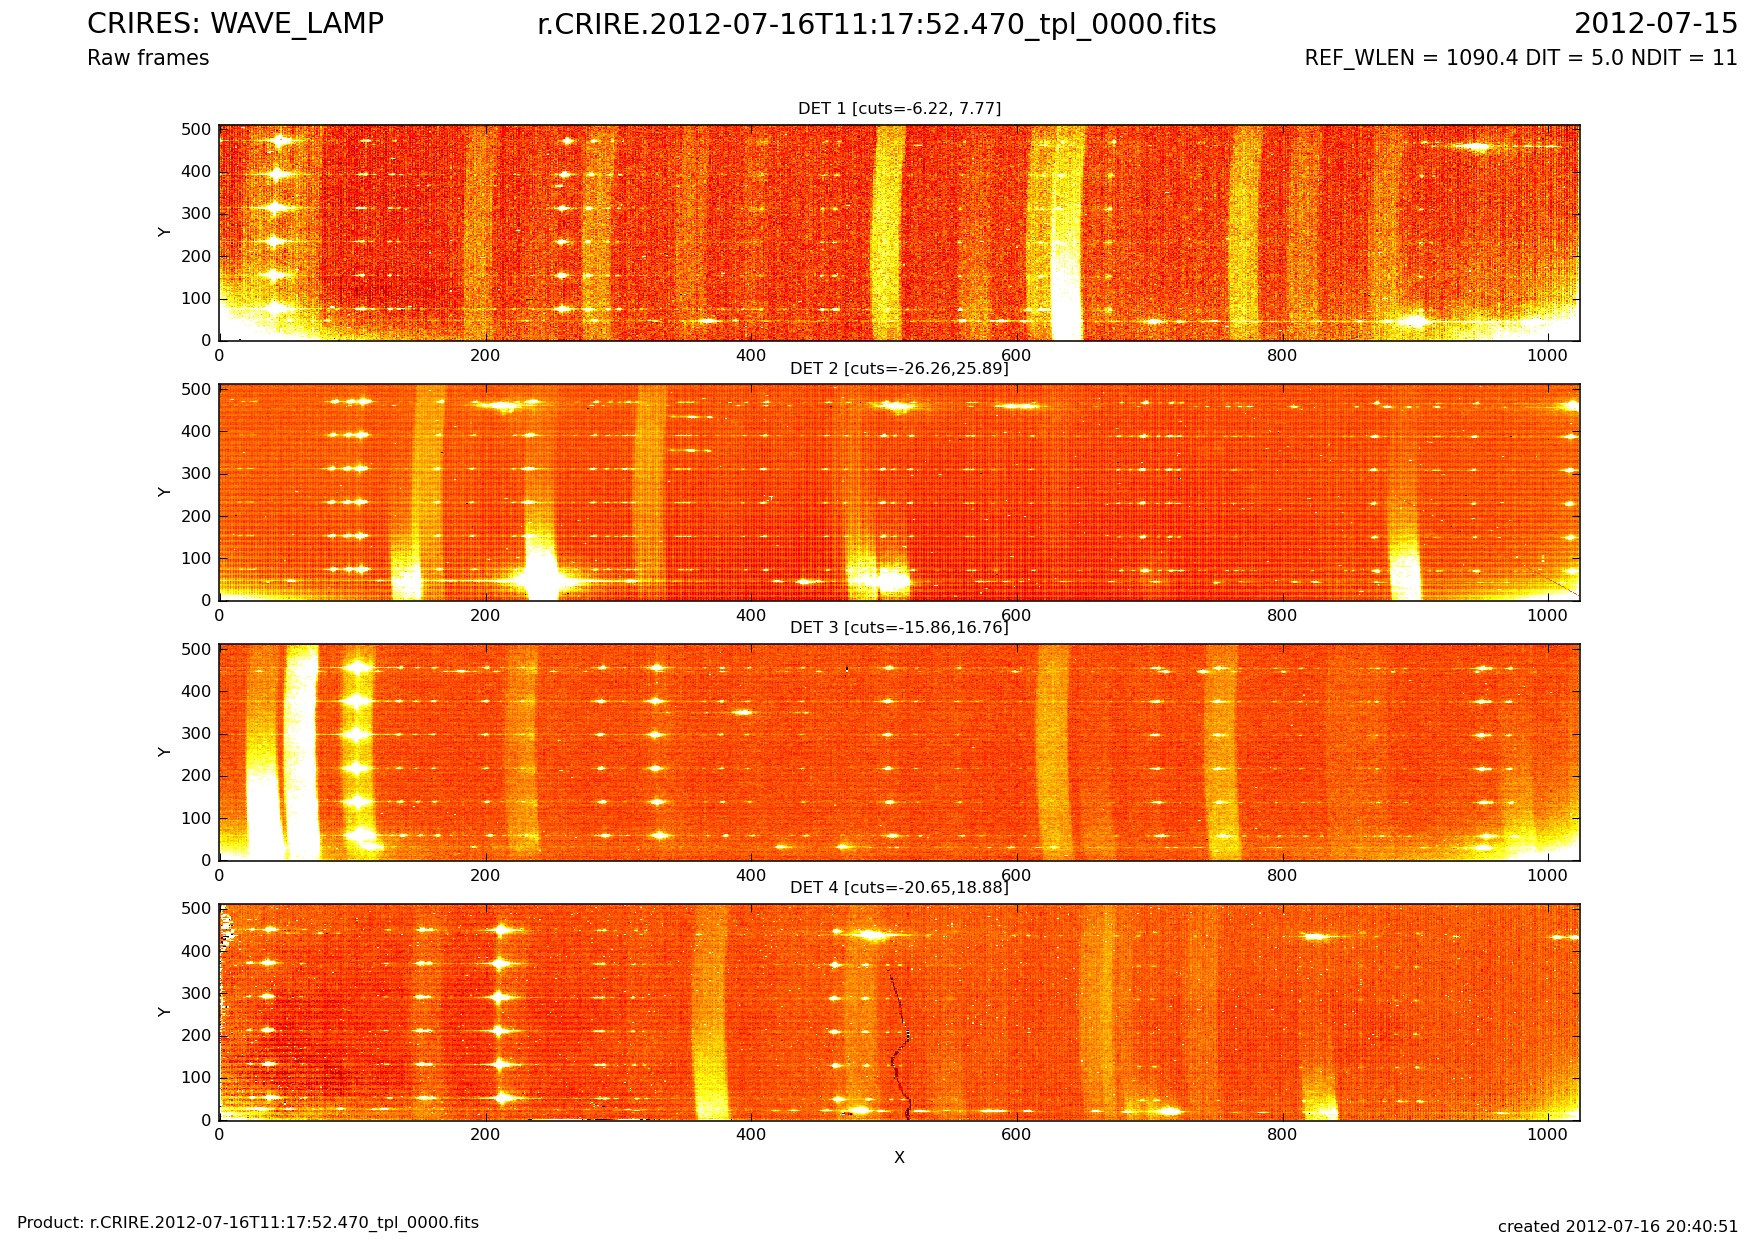
wave1.png average of central rows and comparison to catalog, areas that are subject to vignetting are shaded grey; example for a ThAr arc lamp exposure wave2.png same, but with an N2O absorption cell wave3.png raw frame wave4.png comparison between solution from cross-correlation and from physical model | |||||||||||||||||||||||||||
| QC1PARAM |
QC1 parameters written in QC1 database: QC1 DB names: lambda_cent | dispersion | xcorr | lamp_eff | resolution | resol_fwhm | temp_grat | num_overexp | level_overexp | |||||||||||||||||||||||||||
| ALGORITHM |
The recipe performs a cross-correlation between a catalog and the input frame and
determines polynomial coefficients. It also calls a physical model that provides a wavelength map. lambda_cent: central wavelength on each detector according to cross-correlation solution dispersion: dispersion (nm/pix) from cross-correlation solution xcorr: cross-correlation value; between 0.2 and 1.0 for a successful correlation; -1 means failure lamp_eff: sum of pixel values in a small area around one fibre, backgound subtracted resolution: spectral resolving power resol_fwhm: average FWHM of arc lines in pixels temp_grat: grating temperature num_overexp: number of pixels with values above level_overexp | |||||||||||||||||||||||||||
| CERTIF |
Reasons for rejection: low cross-correlation (or failure) for a setting that can normally be well calibrated; for most standard settings, scoring is available on cross-correlation; there are also reference frames available for comparison | |||||||||||||||||||||||||||
| COMMENTS | ||||||||||||||||||||||||||||
| top | [2015-10-30T08:22:26] created by qcDocu v1.1.2, a tqs tool | |||||||||||||||||||||||||||