Plot
? |
Symb
? |
Source
* |
Average ? |
Thresholds ? |
N_
data |
QC1
parameter |
Data
downloads |
Remarks |
| method |
value |
unit |
method |
value |
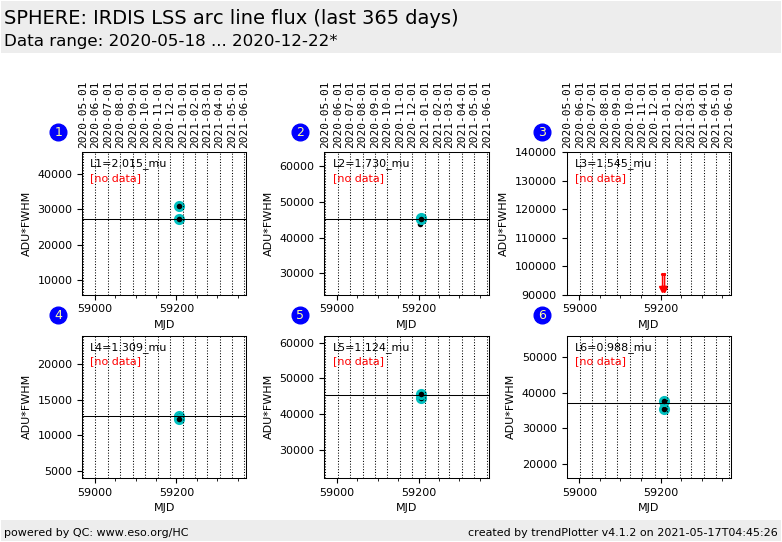
| 1 |
• | QC1DB |
MEDIAN |
27193.7 |
ADU |
none | |
3 |
flux1 |
this |
last_yr |
all
|
slit=WL (0.12'') lamp flux in 2.01533 mu first reddest arc line (the lowest one in the raw frame) |
| 1 |
• | QC1DB |
none |
|
ADU |
none | |
0 |
flux1 |
this |
last_yr |
all
|
slit=NL (0.09'') lamp flux in 2.01533 mu |
| 2 |
• | QC1DB |
MEDIAN |
45137.6 |
ADU |
none | |
3 |
flux2 |
this |
last_yr |
all
|
slit=WL (0.12'') lamp flux in 1.73023 mu second arc line |
| 2 |
• | QC1DB |
none |
|
ADU |
none | |
0 |
flux2 |
this |
last_yr |
all
|
slit=NL (0.09'') lamp flux in 1.73023 mu |
| 3 |
• | QC1DB |
MEDIAN |
67882.1 |
ADU |
none | |
3 |
flux3 |
this |
last_yr |
all
|
slit=WL (0.12'') lamp flux in 1.5451 mu third arc line |
| 3 |
• | QC1DB |
none |
|
ADU |
none | |
0 |
flux3 |
this |
last_yr |
all
|
slit=NL (0.09'') lamp flux in 1.5451 mu |
| 4 |
• | QC1DB |
MEDIAN |
12753.9 |
ADU |
none | |
3 |
flux4 |
this |
last_yr |
all
|
slit=WL (0.12'') lamp flux in 1.3094 mu fourth arc line |
| 4 |
• | QC1DB |
none |
|
ADU |
none | |
0 |
flux4 |
this |
last_yr |
all
|
slit=NL (0.09'') lamp flux in 1.3094 mu |
| 5 |
• | QC1DB |
MEDIAN |
45444.3 |
ADU |
none | |
3 |
flux5 |
this |
last_yr |
all
|
slit=WL (0.12'') lamp flux in 1.12371 mu fifth arc line |
| 5 |
• | QC1DB |
none |
|
ADU |
none | |
0 |
flux5 |
this |
last_yr |
all
|
slit=NL (0.09'') lamp flux in 1.12371 mu |
| 6 |
• | QC1DB |
MEDIAN |
37158 |
ADU |
none | |
3 |
flux6 |
this |
last_yr |
all
|
slit=WL (0.12'') lamp flux in 0.98772 mu last (bluest) arc line |
| 6 |
• | QC1DB |
none |
|
ADU |
none | |
0 |
flux6 |
this |
last_yr |
all
|
slit=NL (0.09'') lamp flux in 0.98772 mu |
| |
|
*Data sources: QC1DB: QC1 database; LOCAL: local data source
|
