Plot
? |
Symb
? |
Source
* |
Average ? |
Thresholds ? |
N_
data |
QC1
parameter |
Data
downloads |
Remarks |
| method |
value |
unit |
method |
value |
| 1 |
• | QC1DB |
MEDIAN |
0.921 |
none |
none | |
10 |
mincoher_ft12 |
this |
last_yr |
all
|
minimum coherence, base line 12, HIGH resolution, FT |
| 2 |
• | QC1DB |
MEDIAN |
0.947 |
none |
none | |
10 |
mincoher_ft13 |
this |
last_yr |
all
|
minimum coherence, base line 13, HIGH resolution, FT |
| 3 |
• | QC1DB |
MEDIAN |
0.942 |
none |
none | |
10 |
mincoher_ft14 |
this |
last_yr |
all
|
minimum coherence, base line 14, HIGH resolution, FT |
| 4 |
• | QC1DB |
MEDIAN |
0.951 |
none |
none | |
10 |
mincoher_ft23 |
this |
last_yr |
all
|
minimum coherence, base line 23, HIGH resolution, FT |
| 5 |
• | QC1DB |
MEDIAN |
0.953 |
none |
none | |
10 |
mincoher_ft24 |
this |
last_yr |
all
|
minimum coherence, base line 24, HIGH resolution, FT |
| 6 |
• | QC1DB |
MEDIAN |
0.944 |
none |
none | |
10 |
mincoher_ft34 |
this |
last_yr |
all
|
minimum coherence, base line 34, HIGH resolution, FT |
| 7 |
• | QC1DB |
MEDIAN |
0.925 |
none |
VAL | 0.85,1.0 |
10 |
mincoher_sc12 |
this |
last_yr |
all
|
minimum coherence, base line 12, HIGH resolution, SC |
| 8 |
• | QC1DB |
MEDIAN |
0.861 |
none |
VAL | 0.85,1.0 |
10 |
mincoher_sc13 |
this |
last_yr |
all
|
minimum coherence, base line 13, HIGH resolution, SC |
| 9 |
• | QC1DB |
MEDIAN |
0.922 |
none |
VAL | 0.85,1.0 |
10 |
mincoher_sc14 |
this |
last_yr |
all
|
minimum coherence, base line 14, HIGH resolution, SC |
| 10 |
• | QC1DB |
MEDIAN |
0.891 |
none |
VAL | 0.85,1.0 |
10 |
mincoher_sc23 |
this |
last_yr |
all
|
minimum coherence, base line 23, HIGH resolution, SC |
| 11 |
• | QC1DB |
MEDIAN |
0.875 |
none |
VAL | 0.85,1.0 |
10 |
mincoher_sc24 |
this |
last_yr |
all
|
minimum coherence, base line 24, HIGH resolution, SC |
| 12 |
• | QC1DB |
MEDIAN |
0.884 |
none |
VAL | 0.85,1.0 |
10 |
mincoher_sc34 |
this |
last_yr |
all
|
minimum coherence, base line 34, HIGH resolution, SC |
| |
|
*Data sources: QC1DB: QC1 database; LOCAL: local data source
|
Plot 1
scores: not implemented
| | data source: | gravity_p2vm
(QC1 database) |
| dataset: | mincoher_ft12 | • |
| median: | 0.921 | none |
| thresholds: | none | |
| N_data plotted: | 10 |
| [click on plot for closeup] |
Plot 2
scores: not implemented
| | data source: | gravity_p2vm
(QC1 database) |
| dataset: | mincoher_ft13 | • |
| median: | 0.947 | none |
| thresholds: | none | |
| N_data plotted: | 10 |
| [click on plot for closeup] |
Plot 3
scores: not implemented
| | data source: | gravity_p2vm
(QC1 database) |
| dataset: | mincoher_ft14 | • |
| median: | 0.942 | none |
| thresholds: | none | |
| N_data plotted: | 10 |
| [click on plot for closeup] |
Plot 4
scores: not implemented
| | data source: | gravity_p2vm
(QC1 database) |
| dataset: | mincoher_ft23 | • |
| median: | 0.951 | none |
| thresholds: | none | |
| N_data plotted: | 10 |
| [click on plot for closeup] |
Plot 5
scores: not implemented
| | data source: | gravity_p2vm
(QC1 database) |
| dataset: | mincoher_ft24 | • |
| median: | 0.953 | none |
| thresholds: | none | |
| N_data plotted: | 10 |
| [click on plot for closeup] |
Plot 6
scores: not implemented
| | data source: | gravity_p2vm
(QC1 database) |
| dataset: | mincoher_ft34 | • |
| median: | 0.944 | none |
| thresholds: | none | |
| N_data plotted: | 10 |
| [click on plot for closeup] |
Plot 7
scores:  2| 2|
| | data source: | gravity_p2vm
(QC1 database) |
| dataset: | mincoher_sc12 | • |
| median: | 0.925 | none |
| fixed thresholds: | 0.85...1.0 | none |
| N_data plotted: | 10 |
| [click on plot for closeup] |
Plot 8
scores: 2|
| | data source: | gravity_p2vm
(QC1 database) |
| dataset: | mincoher_sc13 | • |
| median: | 0.861 | none |
| fixed thresholds: | 0.85...1.0 | none |
| N_data plotted: | 10 |
| [click on plot for closeup] |
Plot 9
scores: 2|
| | data source: | gravity_p2vm
(QC1 database) |
| dataset: | mincoher_sc14 | • |
| median: | 0.922 | none |
| fixed thresholds: | 0.85...1.0 | none |
| N_data plotted: | 10 |
| [click on plot for closeup] |
Plot 10
scores: 2|
| | data source: | gravity_p2vm
(QC1 database) |
| dataset: | mincoher_sc23 | • |
| median: | 0.891 | none |
| fixed thresholds: | 0.85...1.0 | none |
| N_data plotted: | 10 |
| [click on plot for closeup] |
Plot 11
scores: 2|
| | data source: | gravity_p2vm
(QC1 database) |
| dataset: | mincoher_sc24 | • |
| median: | 0.875 | none |
| fixed thresholds: | 0.85...1.0 | none |
| N_data plotted: | 10 |
| [click on plot for closeup] |
Plot 12
scores: 2|
| | data source: | gravity_p2vm
(QC1 database) |
| dataset: | mincoher_sc34 | • |
| median: | 0.884 | none |
| fixed thresholds: | 0.85...1.0 | none |
| N_data plotted: | 10 |
| [click on plot for closeup] |
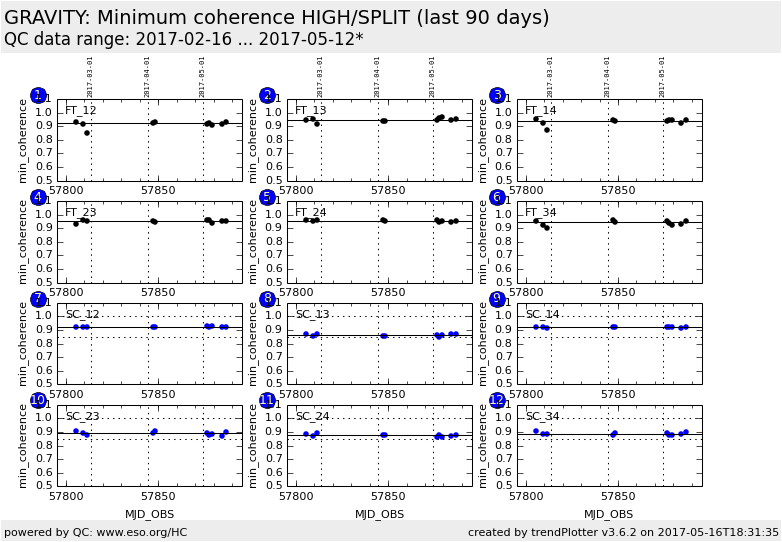
Trending plots for normalized coherence from P2VM calibrations
for each baseline.
Note about LOW resolution: with pipeline version 1.2.x, installed 2019-03-25 for QC,
some QC parameters for P2VM do not give meaningful values. This includes the coherence
for individual baselines.
Plotting of these parameters and scoring has therefore been stopped for LOW resolution.
General information
Click on any of the plots to see a close-up version.
The latest date is indicated on top of the plot.
If configured,
- data points belonging to the latest date are specially marked
- statistical averages are indicated by a solid line, and thresholds by broken lines
- outliers are marked by a red asterisk. They are defined as data points outside the
threshold lines
- "aliens" (= data points outside the plot Y limits) are marked by a red arrow (↑ or ↓)
- you can download the data for each parameter set if the 'Data downloads' link shows up
|
