Plot
? |
Symb
? |
Source
* |
Average ? |
Thresholds ? |
N_
data |
QC1
parameter |
Data
downloads |
Remarks |
| method |
value |
unit |
method |
value |
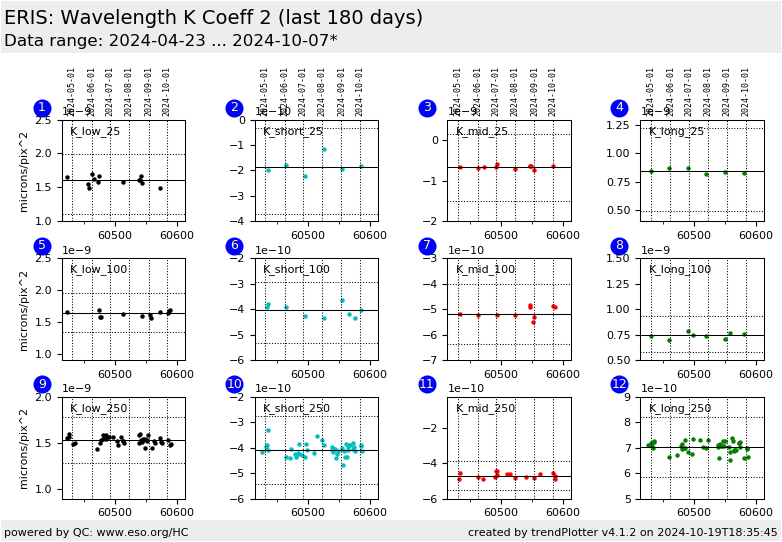
| 1 |
• | QC1DB |
MEDIAN |
1.6e-09 |
microns/pix^2 |
VAL | 0.000000001114,0.000000001988 |
18 |
qc_wave_c2_med |
this |
last_yr |
all
|
C2 coeff wavelength (microns/pix^2):: K_low/25 mas scale |
| 2 |
• | QC1DB |
MEDIAN |
-2.32e-10 |
microns/pix^2 |
VAL | -0.000000000372,-0.000000000034 |
6 |
qc_wave_c2_med |
this |
last_yr |
all
|
C2 coeff wavelength (microns/pix^2):: K_short/25 mas scale |
| 3 |
• | QC1DB |
MEDIAN |
-6.38e-10 |
microns/pix^2 |
VAL | -0.0000000015,0.00000000015 |
9 |
qc_wave_c2_med |
this |
last_yr |
all
|
C2 coeff wavelength (microns/pix^2):: K_middle/25 mas scale |
| 4 |
• | QC1DB |
MEDIAN |
8.88e-10 |
microns/pix^2 |
VAL | 0.000000000492,0.000000001228 |
12 |
qc_wave_c2_med |
this |
last_yr |
all
|
C2 coeff wavelength (microns/pix^2):: K_long/25 mas scale |
|
| 5 |
• | QC1DB |
MEDIAN |
1.7e-09 |
microns/pix^2 |
VAL | 0.00000000134,0.000000001945 |
11 |
qc_wave_c2_med |
this |
last_yr |
all
|
C2 coeff wavelength (microns/pix^2):: K_low/100 mas scale |
| 6 |
• | QC1DB |
MEDIAN |
-4.24e-10 |
microns/pix^2 |
VAL | -0.000000000533,-0.000000000293 |
7 |
qc_wave_c2_med |
this |
last_yr |
all
|
C2 coeff wavelength (microns/pix^2):: K_short/100 mas scale |
| 7 |
• | QC1DB |
MEDIAN |
-5.16e-10 |
microns/pix^2 |
VAL | -0.000000000639,-0.000000000403 |
13 |
qc_wave_c2_med |
this |
last_yr |
all
|
C2 coeff wavelength (microns/pix^2):: K_middle/100 mas scale |
| 8 |
• | QC1DB |
MEDIAN |
7.54e-10 |
microns/pix^2 |
VAL | 0.000000000575,0.000000000932 |
6 |
qc_wave_c2_med |
this |
last_yr |
all
|
C2 coeff wavelength (microns/pix^2):: K_long/100 mas scale |
|
| 9 |
• | QC1DB |
MEDIAN |
1.56e-09 |
microns/pix^2 |
VAL | 0.000000001287,0.000000001777 |
17 |
qc_wave_c2_med |
this |
last_yr |
all
|
C2 coeff wavelength (microns/pix^2):: K_low/250 mas scale |
| 10 |
• | QC1DB |
MEDIAN |
-4.01e-10 |
microns/pix^2 |
VAL | -0.000000000544,-0.000000000274 |
20 |
qc_wave_c2_med |
this |
last_yr |
all
|
C2 coeff wavelength (microns/pix^2):: K_short/250 mas scale |
| 11 |
• | QC1DB |
MEDIAN |
-4.64e-10 |
microns/pix^2 |
VAL | -0.000000000554,-0.000000000387 |
9 |
qc_wave_c2_med |
this |
last_yr |
all
|
C2 coeff wavelength (microns/pix^2):: K_middle/250 mas scale |
| 12 |
• | QC1DB |
MEDIAN |
7.13e-10 |
microns/pix^2 |
VAL | 0.000000000585,0.000000000819 |
22 |
qc_wave_c2_med |
this |
last_yr |
all
|
C2 coeff wavelength (microns/pix^2):: K_long/250 mas scale |
|
| |
|
*Data sources: QC1DB: QC1 database; LOCAL: local data source
|
