Plot
? |
Symb
? |
Source
* |
Average ? |
Thresholds ? |
N_
data |
QC1
parameter |
Data
downloads |
Remarks |
| method |
value |
unit |
method |
value |
| 1 |
• | QC1DB |
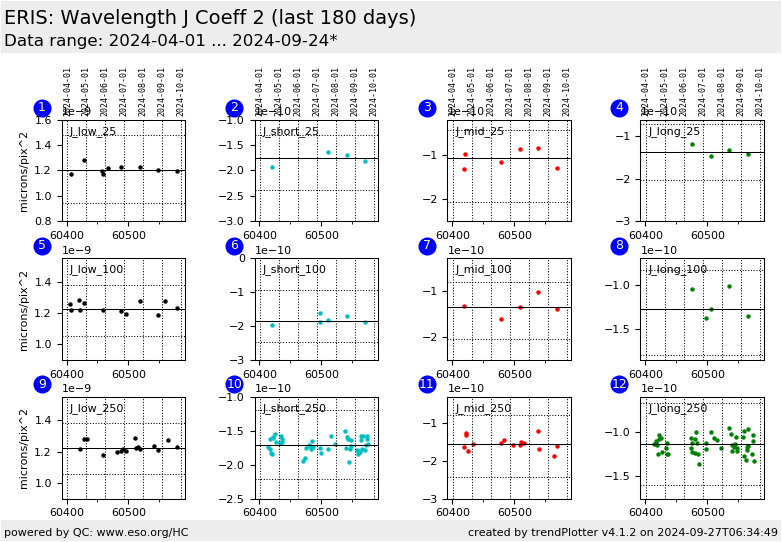
MEDIAN |
1.23e-09 |
microns/pix^2 |
VAL | 0.000000000942,0.000000001478 |
9 |
qc_wave_c2_med |
this |
last_yr |
all
|
C2 coeff wavelength (microns/pix^2):: J_low/25 mas scale |
| 2 |
• | QC1DB |
MEDIAN |
-1.83e-10 |
microns/pix^2 |
VAL | -0.000000000238,-0.000000000131 |
10 |
qc_wave_c2_med |
this |
last_yr |
all
|
C2 coeff wavelength (microns/pix^2):: J_short/25 mas scale |
| 3 |
• | QC1DB |
MEDIAN |
-1.3e-10 |
microns/pix^2 |
VAL | -0.000000000206,-0.000000000044 |
8 |
qc_wave_c2_med |
this |
last_yr |
all
|
C2 coeff wavelength (microns/pix^2):: J_middle/25 mas scale |
| 4 |
• | QC1DB |
MEDIAN |
-1.34e-10 |
microns/pix^2 |
VAL | -0.000000000202,-0.000000000071 |
6 |
qc_wave_c2_med |
this |
last_yr |
all
|
C2 coeff wavelength (microns/pix^2):: J_long/25 mas scale |
|
| 5 |
• | QC1DB |
MEDIAN |
1.25e-09 |
microns/pix^2 |
VAL | 0.000000001056,0.000000001381 |
11 |
qc_wave_c2_med |
this |
last_yr |
all
|
C2 coeff wavelength (microns/pix^2):: J_low/100 mas scale |
| 6 |
• | QC1DB |
MEDIAN |
-1.74e-10 |
microns/pix^2 |
VAL | -0.000000000246,-0.000000000095 |
7 |
qc_wave_c2_med |
this |
last_yr |
all
|
C2 coeff wavelength (microns/pix^2):: J_short/100 mas scale |
| 7 |
• | QC1DB |
MEDIAN |
-1.48e-10 |
microns/pix^2 |
VAL | -0.000000000204,-0.000000000081 |
7 |
qc_wave_c2_med |
this |
last_yr |
all
|
C2 coeff wavelength (microns/pix^2):: J_middle/100 mas scale |
| 8 |
• | QC1DB |
MEDIAN |
-1.27e-10 |
microns/pix^2 |
VAL | -0.0000000001789,-0.0000000000834 |
9 |
qc_wave_c2_med |
this |
last_yr |
all
|
C2 coeff wavelength (microns/pix^2):: J_long/100 mas scale |
|
| 9 |
• | QC1DB |
MEDIAN |
1.22e-09 |
microns/pix^2 |
VAL | 0.000000001054,0.000000001384 |
18 |
qc_wave_c2_med |
this |
last_yr |
all
|
C2 coeff wavelength (microns/pix^2):: J_low/250 mas scale |
| 10 |
• | QC1DB |
MEDIAN |
-1.72e-10 |
microns/pix^2 |
VAL | -0.000000000221,-0.00000000012 |
22 |
qc_wave_c2_med |
this |
last_yr |
all
|
C2 coeff wavelength (microns/pix^2):: J_short/250 mas scale |
| 11 |
• | QC1DB |
MEDIAN |
-1.58e-10 |
microns/pix^2 |
VAL | -0.000000000242,-0.000000000079 |
10 |
qc_wave_c2_med |
this |
last_yr |
all
|
C2 coeff wavelength (microns/pix^2):: J_middle/250 mas scale |
| 12 |
• | QC1DB |
MEDIAN |
-1.14e-10 |
microns/pix^2 |
VAL | -0.0000000001595,-0.0000000000673 |
13 |
qc_wave_c2_med |
this |
last_yr |
all
|
C2 coeff wavelength (microns/pix^2):: J_long/250 mas scale |
|
| |
|
*Data sources: QC1DB: QC1 database; LOCAL: local data source
|
