Control and Monitoring Tool
The rtctkCtrlMonTool is a graphical user interface (GUI) that presents the current RTC deployment and allows basic
inspection and interaction with the RTC components.
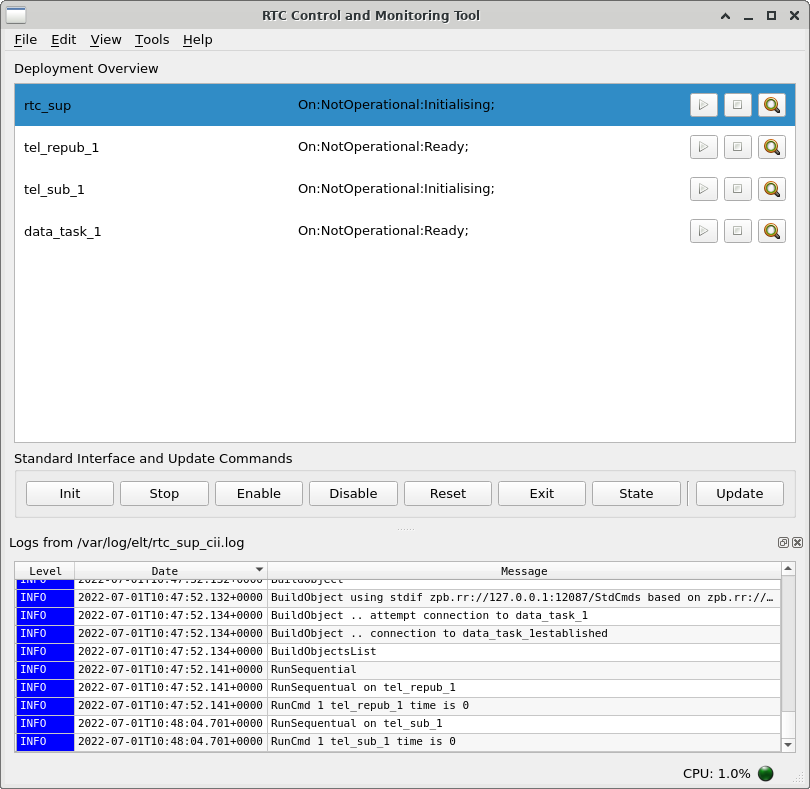
Fig. 5 Control and Monitoring Tool GUI
Starting the Application
In order to be able to start the rtctkCtrlMonTool, the user needs first to make sure:
There is an RTC currently deployed.
The Service Discovery file is present in the Persistent Configuration Repository.
You have an X server available. If the user logs in using
ssh, the option-Xneeds to be used. If a graphical session is used, there is no further configuration needed.
rtctkCtrlMonTool command line help:
$ rtctkCtrlMonTool --help
Usage: rtctkCtrlMonTool [OPTIONS] COMMAND [ARGS]...

  RTC Control and Monitoring Tool.

Options:
  --config URI                    Not implemented yet!. URI indicating the
                                  location of this tool's configuration. This
                                  can either be a URI to a location within the
                                  CII configuration service or to local files.
  --service-discovery-endpoint, --sde URI
                                  URI endpoint to the service discovery. When
                                  using `--config` option it uses first the /r
                                  tctk_config_tool/service_discovery_endpoint
                                  setting found in the configuration.
  --log-level [CRITICAL|FATAL|ERROR|INFO|DEBUG|TRACE|NOTSET]
                                  Sets the global logging level for the tool.
  --quiet                         Makes the tool quite. It will not produce
                                  any output to console
  --help                          Show this message and exit.

Commands:
  gui    RTC Control and Monitoring Tool GUI.
  send   RTC Control and Monitoring Tool send command
  state  RTC Control and Monitoring Tool state command.
rtctkCtrlMonTool is a command based CLI, to access the GUI help:
$ rtctkCtrlMonTool gui --help
Usage: rtctkCtrlMonTool gui [OPTIONS]

  RTC Control and Monitoring Tool GUI.

  Graphical Application that provides an overview of the RTC Components
  deployed and access to their interfaces.

Options:
  --nomad-search-path PATH  Optional path to search for .nomad files. Can be
                            given multiple times. Default is '.'
  --help                    Show this message and exit.
Summary of the Control and Monitoring Tool
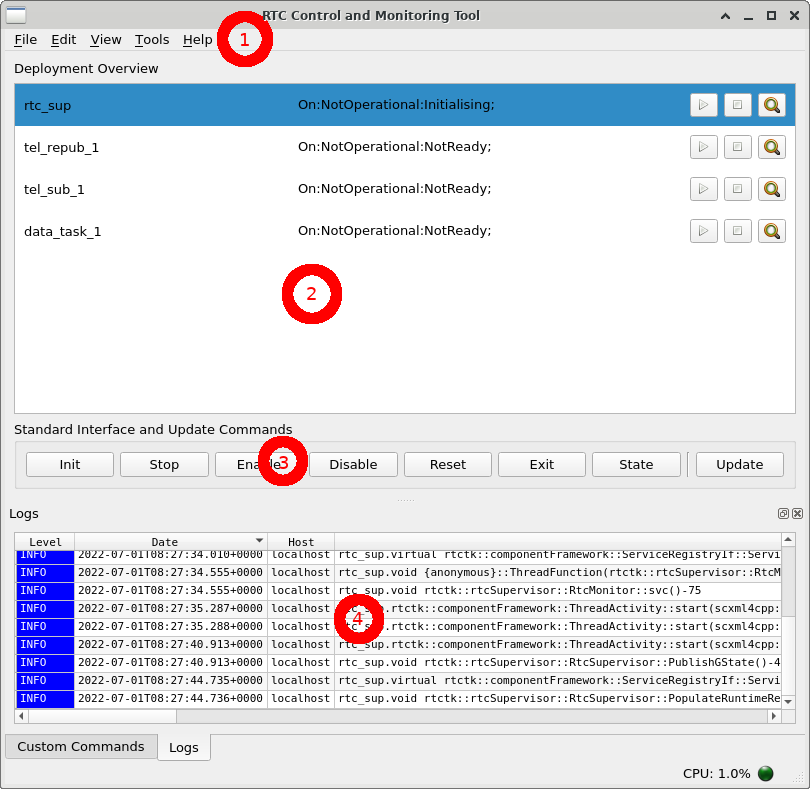
Fig. 6 Sections of the application
Menu: Contains entries to access functionality of the application that is not common to use.
Deployment Overview: Presents a list of all RTC Components declared in the Service Discovery Endpoint.
Standard Interface and Update Commands: Allows interaction with RTC Components through their Standard Interface and Update Interface commands.
Logs: Shows the logs of a specific component, or the logs from the Control and Monitoring Tool.
Deployment Overview
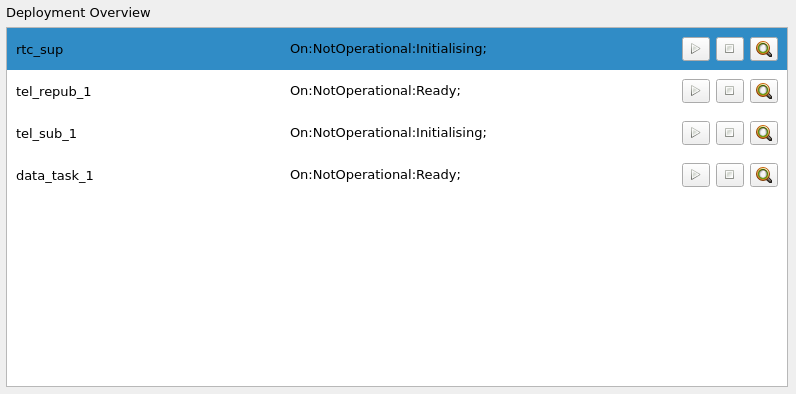
Fig. 7 Deployment Overview
The Deployment Overview contains a list of RTC Components present in the Service Discovery Endpoint. For each component a row is added. The rows shown in Fig. 7 are composed of:
Component Name |
State |
Start Process Button |
Stop Process Button |
Show Logs Button |
The state is automatically updated via OLDB subscription, or via Request-Reply polling of the getState() method in the Standard Interface. The method selection is done using the URI of the OLDB endpoint.
The Play (Start Process) Button will request to Nomad the execution of the associated Nomad Job.
The Stop (Process) Button will request to Nomad that the job is finished.
The last button on the Component is the Magnifying Lens (Show Logs) Button. This will present the logs for the component in the Logs Dock Widget present below.
When a row is selected, it will start automatically a connection to their Request-Reply interfaces. When connections are successful, the Standard Interface and Update Commands Group Box will be enabled for user interaction.
Standard Interface and Update Commands

Fig. 8 Standard Interface and Update Commands (Connected)
Fig. 8 is a depiction of that section of the UI where the user may interact with the selected RTC Component’s Standard and Update Interfaces.
When the Control and Monitoring Tool first starts, this section of the application will not be be active. The user needs first to select a row in the Deployment Overview. This will automatically connect to the RTC Component, and activate this section of the Control and Monitoring Tool.
Upon a successful connection, this section of the UI will be enabled for user interaction.
Clicking on a button will request the command with the same name. Since Requests to the Standard interface do not return any useful feedback information, the user needs to be aware of the expected changes. i.e.: Pressing the Init Button on a Supervisor component will start the initialization sequences of all components in the RTC. State changes can be monitored in the Deployment Overview.
Logs
The Logs Table automatically monitors the logs from the requested RTC Component. Use the Magnifying Lens (Show Logs) Button in the desired component to display its logs in this table.
Columns Shown
By default the columns shown are:
Level
Date
Hostname
Log ID
Message
The user may select a different set of columns by accessing the Logs Table Header context menu. To activate this menu, the user has to right click on the headers of the Logs Table. This will show which columns are shown, and which are not as shown in Fig. 9. From the same menu the user may add or remove columns.
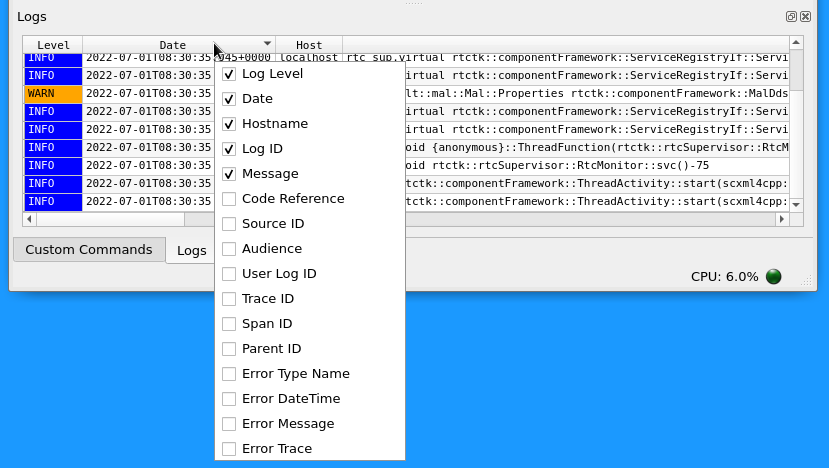
Fig. 9 Logs: Column selection using context menu.
Pause and Lock Operations
Logs are parsed from the files and new entries appear ever second. The table will also automatically scroll to the latest entry when they appear. This behavior is useful for a quick glance, but can be annoying when looking for a specific problem.
By right clicking on the entries section of the table, you can access a context menu that will change this behavior (See Fig. 10).
Pause: No more entries will be presented to the user. They are still being cached into memory, but until the user presses again the Pause button, they are not gonna be added to the table. Its default state is off.
Autoscroll to end: When is on, it moves to the last added entry. When off, the user may scroll freely while entries are added to the table. Its default state is on.
Hide Toolbar: The Logs table toolbar is hidden by default, leaving more space for the logs. But if the user requires filtering operations, they can turn off this option to have access to the Toolbar with more tools.
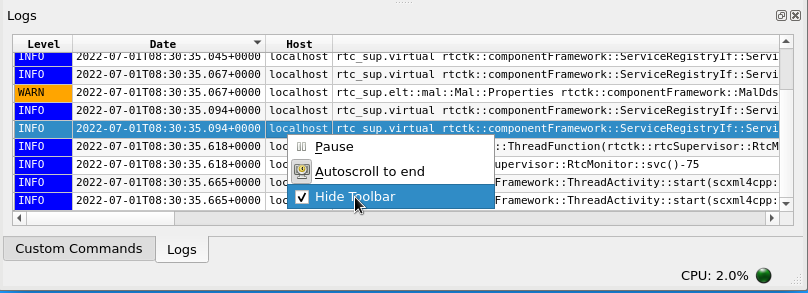
Fig. 10 Logs: Options are hidden in the table context menu.
Filters
Filtering tools include:
Level: FATAL > ERROR > EXCEPTION > WARN > INFO > DEBUG > TRACE. The Log Level Combo Box in the Toolbar sets the minimum level shown.
From: Logs earlier than this will not be shown.
To: Logs later than this will not be shown.
Text: This will match both the LogID and the Message column for the regular expression in the text field.
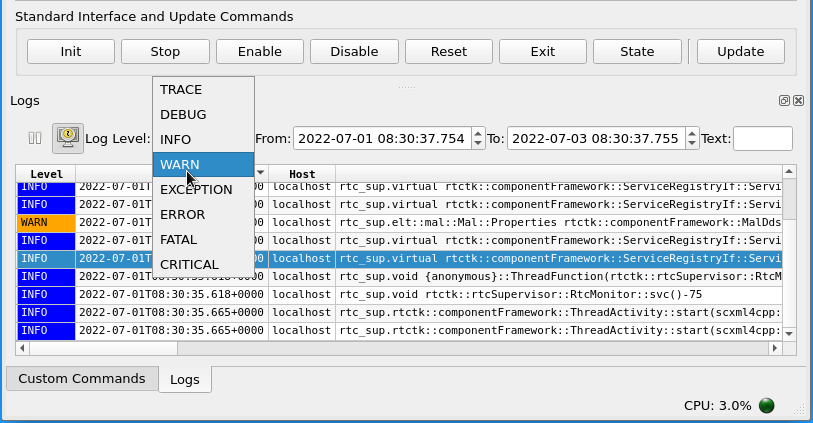
Fig. 11 Logs: Filtering by log level.
For example, in Fig. 12 the Control and Monitoring Tool had its columns LogID and Hostname removed and text filter of “pub” set.

Fig. 12 Logs: Example showing different columns, and message filtering.
Errors
Errors that are important to the user are presented within a light-red background section, as in Fig. 13.
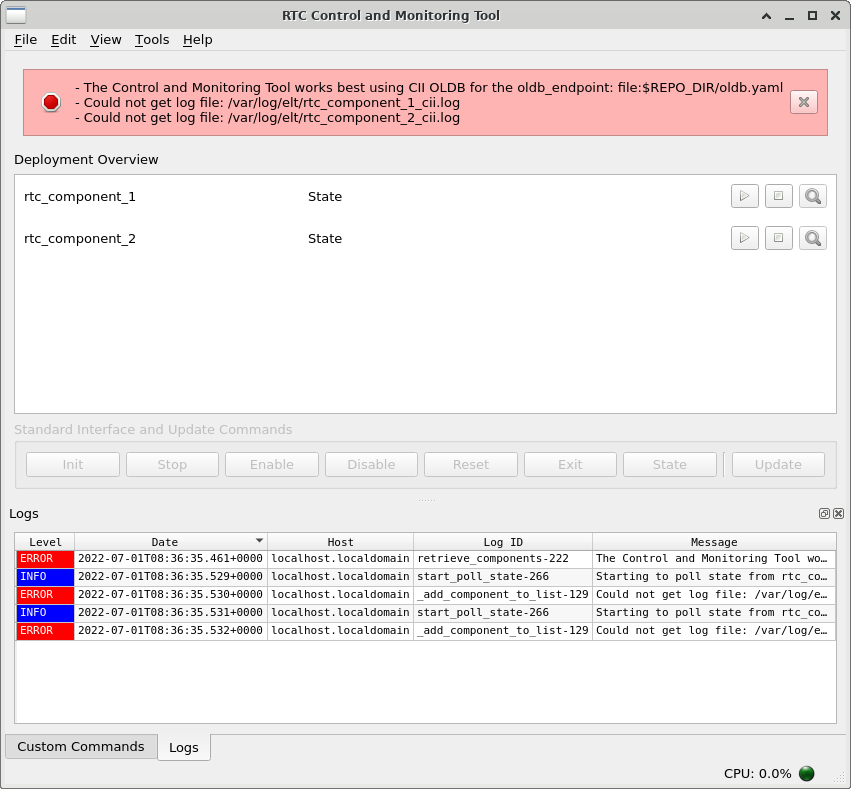
Fig. 13 Errors presented to the user.
The application will try and continue working with the limitations, but the message will only disappear when the user acknowledge it by pressing the X Button.
To find more information, the logs can be checked. Filtering by log level ERROR can be useful.
Known Issues
When selecting a component in the Deployment Overview list, clicking on the state value does not select the component. RTCTK-812
If the oldb_path of the Service Discovery file uses “cii.oldb” schema, the state is updates using subscription. If the scheme is “file”, then it defaults to polling using the MAL Request Reply Standard Interface.
Start and Stopping components only works when using Nomad.
Starting a component that was stopped fails the first time. Retry by pressing the stop button. In any case Nomad tracks the jobs execution, so there is no risk of starting it twice. RTCTK-809