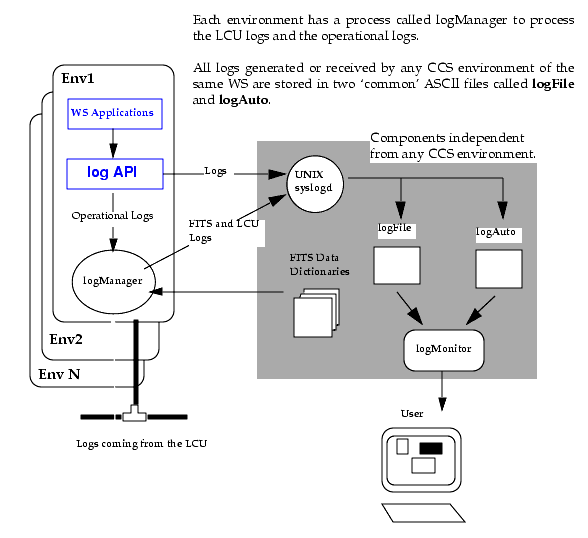
2.11 LOGGING SYSTEM
2.11.1 Basic Concepts
The purpose of the logging system is to provide the user with facilities to log information and to
The logging system supports two kinds of log:
The logging system provides at workstation level facilities to:
Logging of information is based on the following two assumptions:
· Processes running at workstation level always log information in the local node, except logs generated by the error system
· Processes running on the LCU send the logs to the workstation configured as the reporting node for that LCU
The logging system is based on the use of the UNIX daemon syslogd which takes care of the following operations:
The logging system collects logs from each CCS environment and attached LCUs to stores them in two files one, one containing the `Automatic Logs' and the other for the `Normal Logs'.
2.11.2 logManager
The logManager is a background process running in each CCS environment and implements the following functions:
The logging system provides the following utilities to interact with the logManager:
logConfig Force the logManager to reconfigure
logShutdown Stop the logManager
2.11.3 Triggering Message System Automatic Logs
The Message System can be configured to automatically generate logs whenever a process sends or receives a message. The two utilities logEnMsg and logDisMsg are provided to enable/disable automatic log generation.
2.11.4 Data Structures
2.11.4.1 Log Format
This section describes the format of the data structures used by the logging system Log Structure
Logs are composed of three parts:
It is filled automatically by the logging system with the following fields.
Time when the information has been logged.
The format is YY-MM-DD HH:MM:SS.UU, with each digit representing Year - Month - Day - Hour - Minutes - Second and U indicating microseconds
It contains the information provided by the user and has the fields.
2.11.4.2 Log Id
The logId is used to classify the log as `Normal' or `Automatic' according to what is summarized in the following table.
Automatic Logs are generated by specific modules and they have the purpose to help debugging and maintenance. For example the database and the message system can be configured to generate logs when specific activities take place.
Logs should be predefined into log definition files, and accessed by applications through their reference mnemonic. It is up to the application developer to split the logs into the different categories: each one gives the user the possibility to use an internal sub-division of logs belonging to the same category.
The column `Mnemonic' specifies the mnemonic to be used in as parameter `logId' of the logData()
2.11.5
2.11.5.1 Log Definition Files
This part is not supported any longer !!
This functionality has been kept for backward compatibility and will be taken away.
The logging system support the logging of operational logs in FITS format with a set of dedicated routines.
2.11.6 Support for Operational Logs
The logging system provides routines to log operational logs in FITS format: each routines supports a given type of operational log (This is described in detail in [19])
Each FITS operational is defined in a `dictionary' and it is identified by a hierarchical keyword:
according to the following definitions:
· Dictionary: defines the dictionary where to check the correctness of the Fits action verb and keywords.
· Category: pre-defined and designated by a 3-letter abbreviation. Examples of `category' are DET (Detector), TEL (Telescope) ADA (Adapter) or INS (Instrument)
· Subsystem: identifies a component in a category and can consist of zero or at maximum 2 words. Examples of `subsystems' are GRIS (grism), LAMP, CCD (detector Chip) or EXPO (Exposure Description)
· Parameter: identifies the parameter within the subsystem. Examples of keywords for `parameter' are ALT (Altitude)TEMP (Temperature) or WLEN (Wavelength)
A log record have the general format:
The following types of FITS operational logs are supported:
· Action Records. Generates a log describing an action: typical examples are opening and closing operations or moving the telescope.
· Parameter Records. Generate a log recording information on the status of the components of a given system: typical examples are wind speed, guide star RA/DEC or exposure number.
· Parameters Array. Some operational information can be logged as an array of numbers or strings. The values must be separated by commas and have the following format:
where the array index specifies the position of the first value within the array (the first element of the array starts at index 1)
2.11.7 Log FITS Place-holders
For FITS logs of type `parameter records' the comment field gives a brief description of the keyword's meaning and it can also include a replacement tag. The tag gets replaced by the value of the FITS parameter converted into the unit described by the tag when the keyword is written to the log file.
Tags are strings starting with "%" and the following are supported:
Example of FITS logs containing the tags:
TEL RA = 201.675000 / %HOURANG RA (J2000) pointing (deg) [TEL2]
FITS_TIME> TEL DEC = -47.46600 / %DEGREE DEC (J2000) pointing (deg) [TEL2]
same logs after beeing processed :
TEL RA = 201.675000 / 13:26:42 RA (J2000) pointing (deg) [TEL2]
FITS_TIME> TEL DEC = -47.46600 / -47:27:57 DEC (J2000) pointing (deg) [TEL2]
2.11.8 Archiving of logs
The operational logs are now labelled according to the WS CCS environment where they have been collected and logged. This feature allows the system to sort out the operational logs of a specific WS environment when there are several CCS environments running on the same machine.
The following is an example on how the format of the operational logs has changed.
During the whole day the operational logs are collected and stored into the file $VLT_LOG_FILES/currentDay.ops.log which is processed at noon of the next day to create the real file to be archived. During the 'archiving' process the name of the WS environment is stripped from the operational log and the logs are sorted according to the 'WS' environment name and are stored in different files.
The name of the file also contains the name of the WS environment where the logs have been collected, for example :
The operational logs stored in those files have the same format as before, therefore there is no "backwards incompatibility" introduced.
The operational logs are archived using the following procedure:
· The operational sorted according to the name of the WS environment and stored in different files, each having the following format : <WS_ENV_NAME>.YYYY-MM-DD.ops.log. The date refers to the day `before'.
· A symbolic link pointing to the file to be archived is created and it is used by the utility vcsolac to detect that there is something to archive.
· Once the file is successfully archived, vcsolac removes the link and sets the file's protections to `writable'
Normal logs are also archived using the same procedure and the file to be archiveed named according to the following syntax :
2.11.9 Log Clean-up
· The current log file is `moved' to a backup copy and the current one cleared. The backup copy is overwritten every time a new backup is made.
2.11.10 Programmatic Interface
The programmatic interface consist of the following routines:
logData(), logData1() Direct log of textual information.
2.11.11 Programming Rules
The logId is used to select between `Normal' and `Automatic' logs according to the following table:
Use mnemonics to identify logIds as follows :
where logAUTO_RANGE defines the range where logs are classified as `Automatic'
The length of the log array is defined by the following constants:
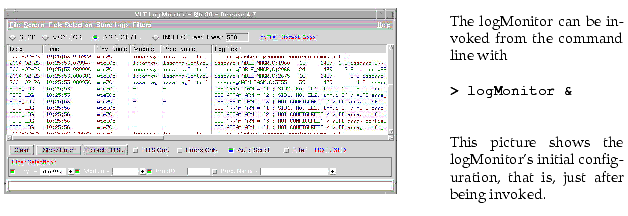
2.11.12 logMonitor
The logMonitor is a Tcl/Tk application used to display and inspect the log messages.
The features of the logMonitor are:
· Selection of the format for displayed logs and provides filtering capabilities on what to be displayed.
· Usage of the Unix AWK tool and generation of a suitable program which can be used outside the logMonitor for general purpose
The first actions are usually to activate one of the Mode Selector buttons MONITOR or INSPECT and if necessary set the proper filter to select logs according to given parameters.
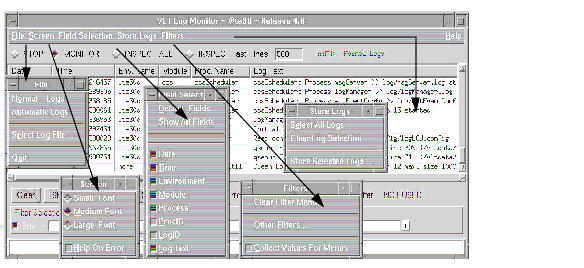
2.11.12.1 Menu Bar
The Menu Bar consists of the following menu buttons:
File contains the following entries
· Select Log File: Gives the user the possibility to open a given log File. This can be used to "INSPECT" a file containing backup logs.
Screen contains a list of fonts to and a check button that enables the automatic display of the help file associated to the error log.
Field Selection contains a set of check buttons to customize the formatting of the displayed logs.
· List of Fields Selection: Gives the possibility to display the logs selecting different fields of the log string, such as: Date, Time, Environment Name, Process, Process Id Number, Log Id Number and log Text which contains the remaining part of the log.
Store Logs contains a set of buttons to select a set of logs to store into a file.
· Select All Logs: Selects all logs The user can also select a subset of logs by dragging the cursor on to the displayed logs.
· Store Selected Logs: Allows the user to store the selected logs into a file. A file browser is used to select the file.
Filters contains a set of buttons providing more specific filtering capabilities (For more information see paragraph 2.11.12.5)
· Collect Values For Menus: Enables the logMonitor to automatically collect the values of the filters.
2.11.12.2 Mode Selection
Below the Menu Bar there are three mutually exclusive buttons which select the current mode:
The last 20 lines of the selected log file will be filtered and displayed immediately, each newly generated log line will be filtered and appended to the display automatically.
The whole selected log file will be filtered and displayed but arriving log are not displayed. This mode can be re-initialized by pressing the INSPECT button again.
During the processing of the file, a dialog box let the user know how far in the processing we are and if it takes too long the user can stop it by clicking on STOP.
Note that the processing of a large log file can take several seconds before the display is updated, therefore the Filter Selection should always be set up before this mode is started.
In the same row two Indicators display:
· If the filter is active, the indicator "Log Filter IN USE" appears, otherwise not. See section 2.11.12.5 on page 148 for details of the filter operation.
2.11.12.3 Log Display
The log lines are displayed in a list box with vertical/horizontal scroll bars and provides the following features:
· Formatted display of the log lines. The label at the top indicates which fields are displayed. and it scrolls along with the text in the main display: the display can be re-sized in both directions if the logs are too long.
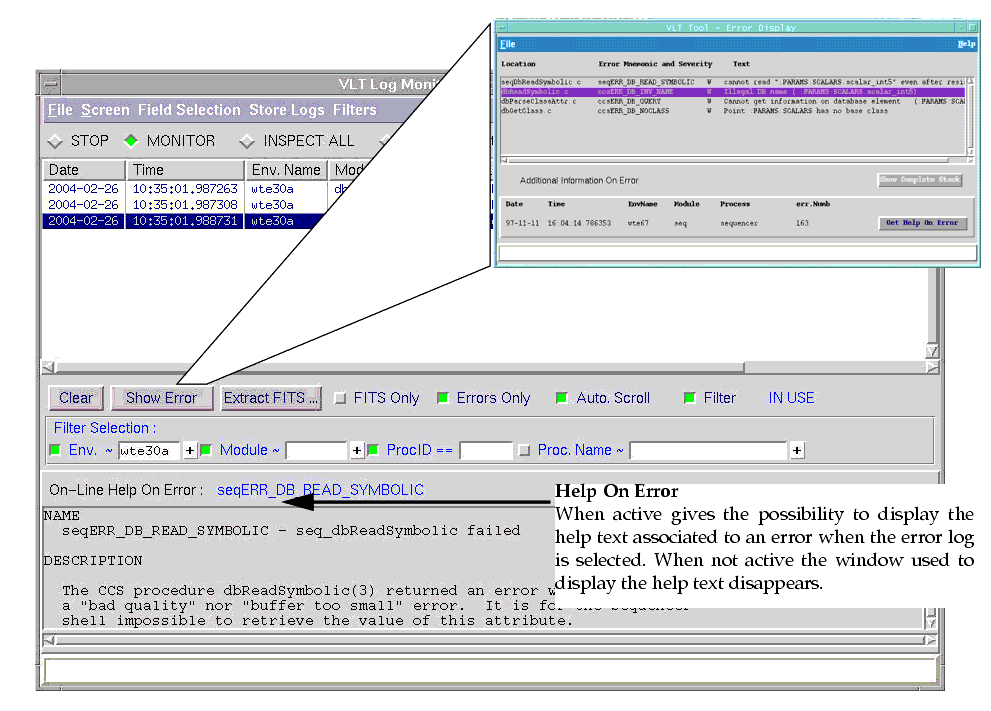
· Display the help text associated to an error: the window appears automatically by clicking on "Help On Error" and disappears when this feature is not used.
The main panel supports the following operations:
· Show Error Stack
Allows the user to see all the logs belonging to the same error stack. The user should select a log and then click on "Show Error Stack": the stack is displayed in a separate window.
· Extract Fits: This button calls a graphical interface dedicated to the display of operational logs ( see paragraph ).
· Fits Only: allows the user to see only the operational logs. In this case the user can also set the filter mode to display the logs from a specific environment.
· Auto Scroll: it is enable by default. When disabled the logs are added to the bottom of the list but it does not trigger any scrolling -i.e.- the user must act on the scroll bar to see the last logs. This mode is useful in the "MONITOR" mode to read some previous logs.
· Filter: Enables the filtering of logs according to the values of the different filter fields. (see paragraph 2.11.12.5) The indicator "IN USE" will be displayed next to the check button.
· Select a log line with mouse button 1, then double-click button 1 to copy the date and time fields into the first "Date Time" Subfilter entry (as starting date/time)
· Select a log line with mouse button 1, then double-click button 2 to copy the date and time fields into the second "Date Time" Subfilter entry (as ending date/time)
· Select a log with mouse button 1, then double-click button 3 to copy the values of "Environment", "Module", "Process Name", "Process Id" to the corresponding filter entries.
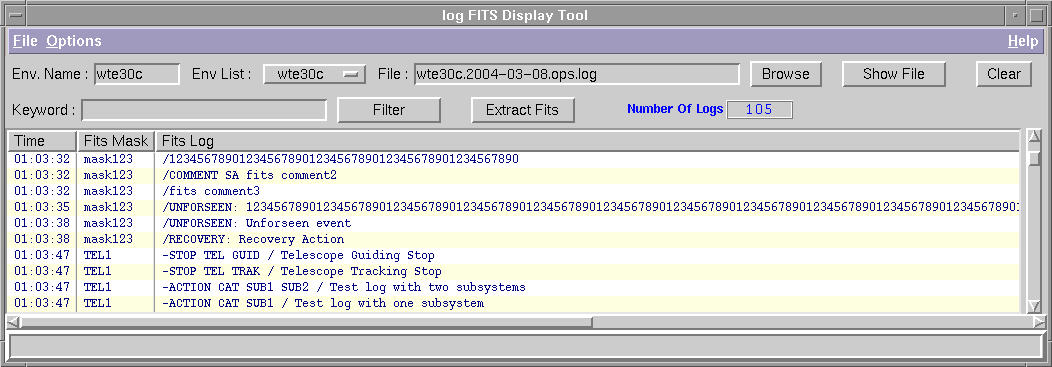
2.11.12.4 logFitsDisplay
During the night the generated operational logs are partly stored in the default "logFile" and in the temporary file "currentDay.ops.log". This tools allows the user to collect the operational logs stored in to these two files display and display them all together.
It is also able to display the operational logs stored in a file ready to be archived.
The tool can be called by clicking on the "Extract Fits" button of the logMonitor or can be called from the command line as :
When it starts the tool gets the list of environments by reading the files "logFile" and "currentDay.ops.log". This list is used to configure the option button "Env. List".
This button allows the user to see all the operational logs not yet archived. The collected logs are stored in a temporary file whose format is "logTemp_<whoami>.ops.log" . The name of this file is also visible in the "File" entry widget.
This button allows the user to see the contents of file of operational logs ready to be archived, that is, all the files with "ops.log" extension.
The entry field "Keyword" allows the user to specify a word to be used to select a subset of the operational logs. All the logs containing in the "Fits Log" part that keyword will be displayed.
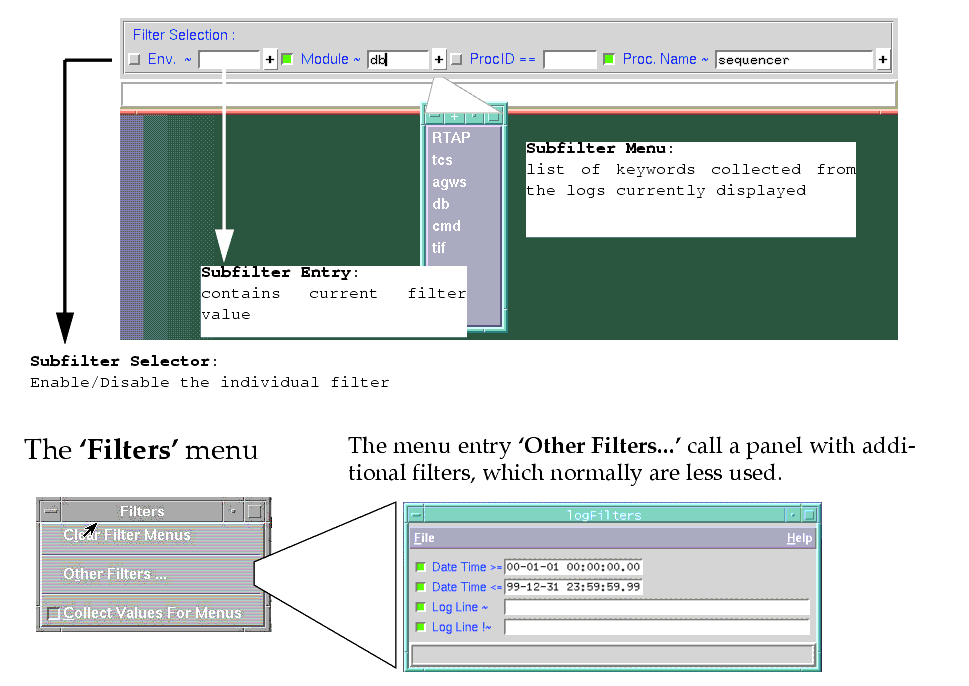
2.11.12.5 Filter Selection
The logMonitor provides some filtering capabilities to select the log which shall be displayed.
The logMonitor starts with the flag `Apply Filter' disabled. The most common filters appear at the bottom of the logMonitor, while others can be set by calling an auxiliary panel through the entry Other Filters... in the Filters menu.
The `Filters' menu contains the following entries:
· Collect Values For Menus
This option enables the logMonitor to automatically collect the values of the filters from the displayed logs. The collected values are stored in the corresponding subfilter menus.
The filtering of logs is based on several Subfilters: a log must pass ALL Subfilters in order to be displayed (logical AND). Subfilters can be individually disabled, in such a case they are not taken into account when selecting the logs to be displayed.
Each filtering field is based on the following components:
· Subfilter Selector
If the button indicator is on, the Subfilter will be included in the filter operation, otherwise it will not be applied.
· Subfilter Entry
If this text entry is not empty, the text or number in the entry will be compared with the corresponding field in the log line, applying the comparison operation indicated in front of the entry (described below). The RETURN key can be used to update the current filtering setup and activate it. ("Apply Filter" button has the same effect).
· Subfilter Menu
Some filters have a menu automatically collecting the corresponding values from the displayed log: the menu entry "Collect Values For Menus" turns this feature on. A menu entry can be selected to copy its value into the Subfilter Entry.
Before each Subfilter Entry the type of comparison operation is indicated:
The syntax of regular expressions must follow the rules for the awk utility.
The Date/Time should be entered in the format "YY-MM-DD hh:mm:ss.nn" (one space between date and time) in order to get correct results. Fields may be omitted from right to left only. The entered format is not checked.
2.11.12.6 Known Problems
· Collect Values for Menus (see section 2.11.12.5 on page 148):
Since the log fields are regarded as elements of Tcl lists, there are problems with fields containing special delimiter characters like braces. Normally those fields are simply skipped, but if a Tcl error window appears it should be acknowledged with OK.
2.11.13 Configuration
When the logging system is installed for the first time the syslogd UNIX daemon must be configured to log the data in the proper files: the procedure must be done with superuser (`root') privileges, as follows:
This line avoids to have the same information logged also in the system log file /usr/adm/syslog.
<logPath> is the directory where the log files will be created The files are automatically created by syslogd when the first log arrives.
Installation of log cleanup procedure.
To install the log cleanup procedure do as follows:
· Check that the logVLTBackup.cron is installed in $VLTROOT/config and verify that the parameters specified in logVLTBackup.cron match the current configuration.
In particular that all references to the environment variables VLTROOT, VLT_LOG_FILES and INS_ROOT are set to the proper values (see man page of logVLTBackup for more details).
0,5,10,15,20,25,30,35,40,45,50,55 * * * * <VLTROOT>/bin/logVLTBackup <FITS_OWNER> <FITS_GROUP> <Archive-hour> ?MAX_SIZE?
Define the following environment variables
It is an ASCII file containing the association between LCU name and corresponding workstation reporting node: there should be one of these files for each environment talking with an LCU.
Each line of the file specifies the LCU environment name and the environment name of the WS reporting node, as specified in the following example:
The log module provides the script logCreateLcuConfig to properly create this file. The file is created under the $VLTDATA/ENVIRONMENTS/<env> directory with the name logLCU.config.
At start-up the logManager first tries to load this LCU configuration table and only if it does not exist, it loads the LCU configuration files stored under the $VLT_LOG_ROOT directory.
This last possibility has been kept for backwards compatibility and allows the logManager to load the following files:
2.11.14 Reference
|
Quadralay Corporation http://www.webworks.com Voice: (512) 719-3399 Fax: (512) 719-3606 sales@webworks.com |