Plot
? |
Symb
? |
Source
* |
Average ? |
Thresholds ? |
N_
data |
QC1
parameter |
Data
downloads |
Remarks |
| method |
value |
unit |
method |
value |
| 1 |
• | QC1DB |
MEDIAN |
436 |
number |
VAL | 0,3145728 |
191 |
qc_persis_nsat_max |
this |
last_yr |
all
|
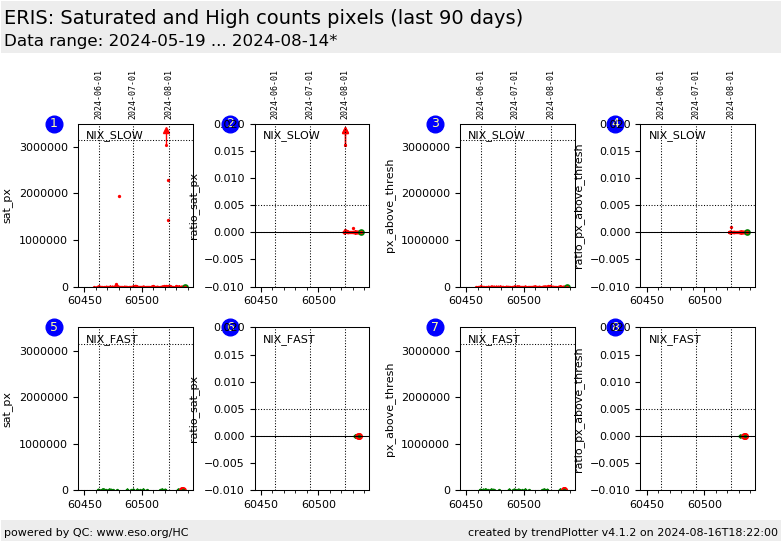
NIX_SLOW: maximum number of saturated pixels |
| 2 |
• | QC1DB |
MEDIAN |
1.13e-05 |
number |
VAL | 0,.005 |
191 |
qc_persis_nsat_frac |
this |
last_yr |
all
|
NIX_SLOW: ratio of saturated pixels |
| 3 |
• | QC1DB |
MEDIAN |
3 |
number |
VAL | 0,3145728 |
191 |
qc_persis_nthresh_max |
this |
last_yr |
all
|
NIX_SLOW: maximum number of pixels above 15000*.75 |
| 4 |
• | QC1DB |
MEDIAN |
4.77e-07 |
number |
VAL | 0,.005 |
191 |
qc_persis_nthresh_frac |
this |
last_yr |
all
|
NIX_SLOW: ratio of pixels above 15000*.75 |
| 5 |
• | QC1DB |
MEDIAN |
0 |
number |
VAL | 0,3145728 |
53 |
qc_persis_nsat_max |
this |
last_yr |
all
|
NIX_FAST: maximum number of saturated pixels |
| 6 |
• | QC1DB |
MEDIAN |
0 |
number |
VAL | 0,.005 |
53 |
qc_persis_nsat_frac |
this |
last_yr |
all
|
NIX_FAST: ratio of saturated pixels |
| 7 |
• | QC1DB |
MEDIAN |
0 |
number |
VAL | 0,3145728 |
53 |
qc_persis_nthresh_max |
this |
last_yr |
all
|
NIX_FAST: maximum number of pixels above 49000*.75 |
| 8 |
• | QC1DB |
MEDIAN |
0 |
number |
VAL | 0,.005 |
53 |
qc_persis_nthresh_frac |
this |
last_yr |
all
|
NIX_FAST: ratio of pixels above 49000*.75 |
| |
|
*Data sources: QC1DB: QC1 database; LOCAL: local data source
|
Plot 1
scores:  11| 11|
| | data source: | eris_nix_persistence
(QC1 database) |
| dataset: | qc_persis_nsat_max | • |
| median: | 436 | number |
| fixed thresholds: | 0...3145728 | number |
| N_data plotted: | 191 |
| [click plot for closeup] |
Plot 2
scores: not implemented
| | data source: | eris_nix_persistence
(QC1 database) |
| dataset: | qc_persis_nsat_frac | • |
| median: | 1.13e-05 | number |
| fixed thresholds: | 0...0.005 | number |
| N_data plotted: | 191 |
| [click plot for closeup] |
Plot 3
scores: 11|
| | data source: | eris_nix_persistence
(QC1 database) |
| dataset: | qc_persis_nthresh_max | • |
| median: | 3 | number |
| fixed thresholds: | 0...3145728 | number |
| N_data plotted: | 191 |
| [click plot for closeup] |
Plot 4
scores: not implemented
| | data source: | eris_nix_persistence
(QC1 database) |
| dataset: | qc_persis_nthresh_frac | • |
| median: | 4.77e-07 | number |
| fixed thresholds: | 0...0.005 | number |
| N_data plotted: | 191 |
| [click plot for closeup] |
Plot 5
scores: 2|
| | data source: | eris_nix_persistence
(QC1 database) |
| dataset: | qc_persis_nsat_max | • |
| median: | 0 | number |
| fixed thresholds: | 0...3145728 | number |
| N_data plotted: | 53 |
| [click plot for closeup] |
Plot 6
scores: not implemented
| | data source: | eris_nix_persistence
(QC1 database) |
| dataset: | qc_persis_nsat_frac | • |
| median: | 0 | number |
| fixed thresholds: | 0...0.005 | number |
| N_data plotted: | 53 |
| [click plot for closeup] |
Plot 7
scores: 2|
| | data source: | eris_nix_persistence
(QC1 database) |
| dataset: | qc_persis_nthresh_max | • |
| median: | 0 | number |
| fixed thresholds: | 0...3145728 | number |
| N_data plotted: | 53 |
| [click plot for closeup] |
Plot 8
scores: not implemented
| | data source: | eris_nix_persistence
(QC1 database) |
| dataset: | qc_persis_nthresh_frac | • |
| median: | 0 | number |
| fixed thresholds: | 0...0.005 | number |
| N_data plotted: | 53 |
| [click plot for closeup] |
Saturation and number of counts higher than the define threshold. The saturation level and the threshold are given to the pipeline as input parameters
The value of the thresholds are the following
IFU:
- Saturation level: 60000
- high counts threshold: 45000
NIX:
- SLOW readout:
-- Saturation level: 15000
-- threshold: 12000
- FAST readout:
-- Saturation level: 49000
-- threshold: 37000
General information
Click on any of the plots to see a close-up version.
The latest date is indicated on top of the plot.
If configured,
- data points belonging to the latest date are specially marked
- statistical averages are indicated by a solid line, and thresholds by broken lines
- outliers are marked by a red asterisk. They are defined as data points outside the
threshold lines
- "aliens" (= data points outside the plot Y limits) are marked by a red arrow (↑ or ↓)
- you can download the data for each parameter set if the 'Data downloads' link shows up
|
