| This documentation is intended both for QC scientists and SciOps astronomers (who may want to ignore the technical information displayed in grey). | ||||||||||||||||||||||||||||
|
||||||||||||||||||||||||||||
|
||||||||||||||||||||||||||||
| bottom plots | contact | ||||||||||||||||||||||||||||
| NAME | hawki_flat.py | |||||||||||||||||||||||||||
| VERSION |
1.0 -- adapted from HAWKI/hawki_dark.html (Feb 2009) | |||||||||||||||||||||||||||
| SYNTAX | SHELL | |||||||||||||||||||||||||||
| CALL |
hawki_flat.py from $DFS_PRODUCT/FLAT/$DATE: hawki.processQC -a <AB> | |||||||||||||||||||||||||||
| INSTRUMENT | HAWKI | |||||||||||||||||||||||||||
| RAWTYPE | DARK | |||||||||||||||||||||||||||
| PURPOSE | compares raw and product FLAT files for HAWK-I QC assessment; the plots are later reviewed within certifyProducts. All plots are stored in $DFO_PLT_DIR/$DATE. | |||||||||||||||||||||||||||
| PROCINPUT |
first and last raw FLATs from AB; FLAT_IM and FLAT_STATS products; currently not analyzed: BPM_HOT | |||||||||||||||||||||||||||
| QC1TABLE |
trending | table(s) in QC1 database: hawki_twflat | |||||||||||||||||||||||||||
| TRENDPLOT |
trending | HealthCheck plot(s) associated to this procedure: None_so_far... | |||||||||||||||||||||||||||
| QC1PAGE |
trending | associated documentation: flat_qc1.html | |||||||||||||||||||||||||||
| QC1PLOTS top |
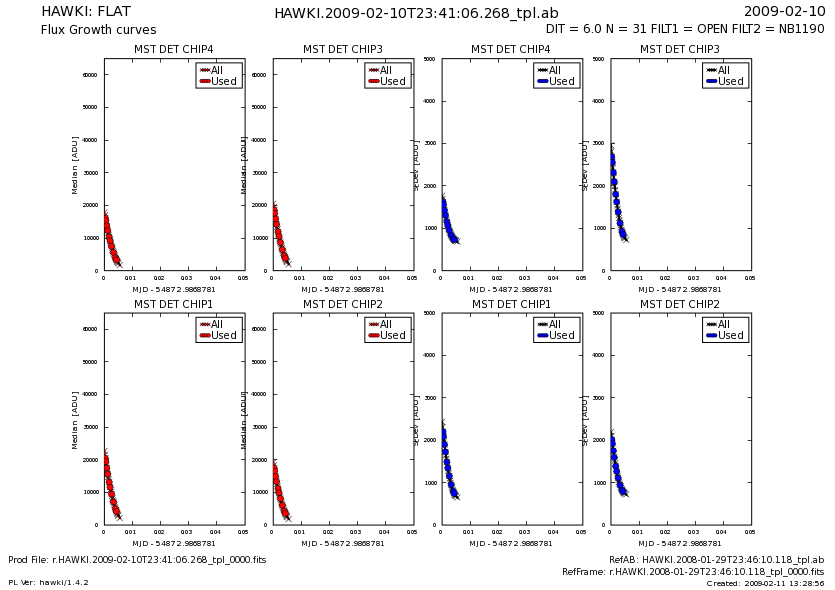
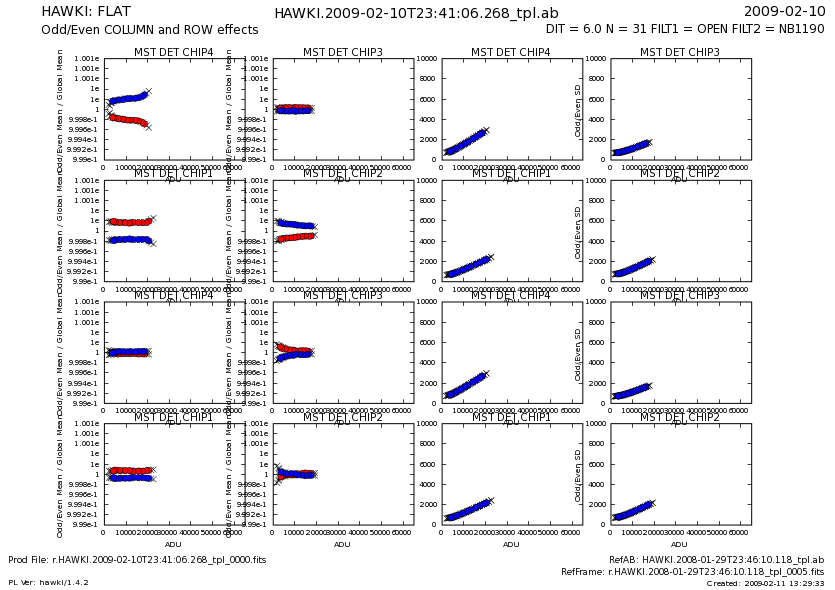
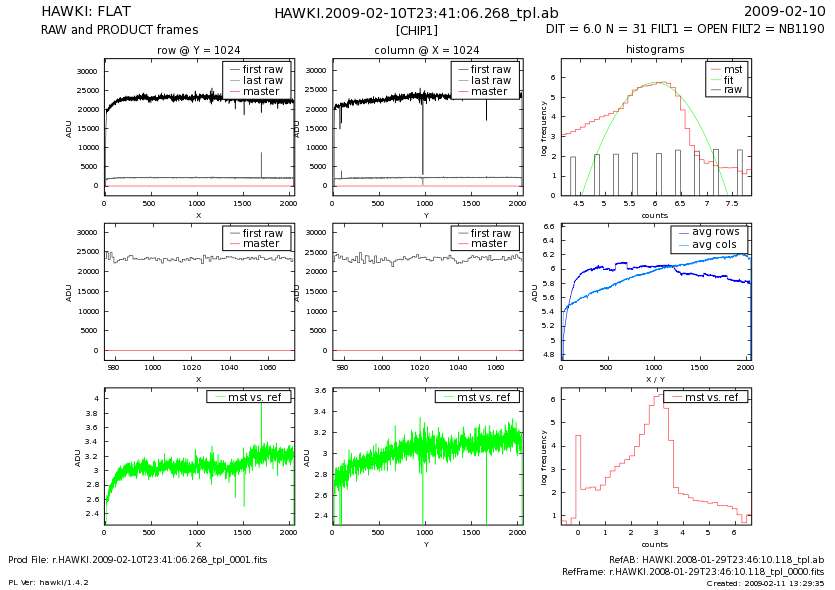
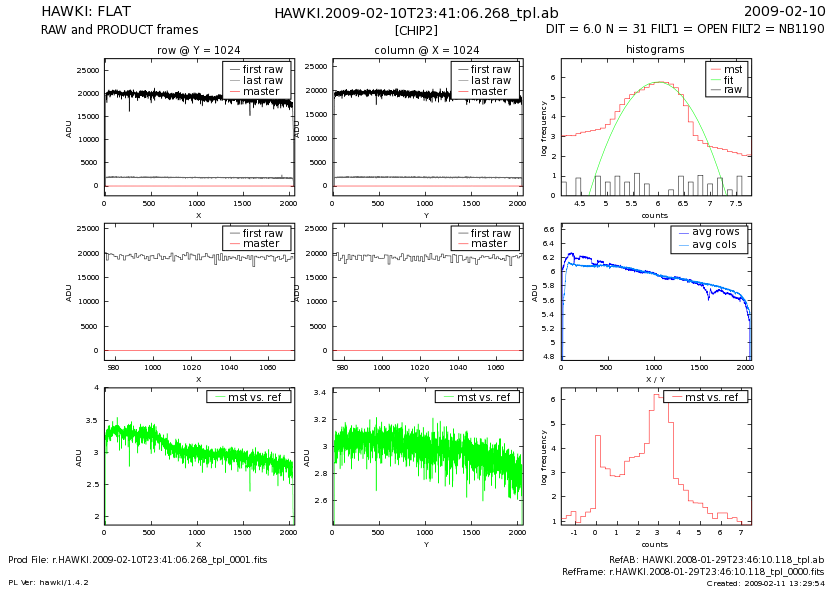
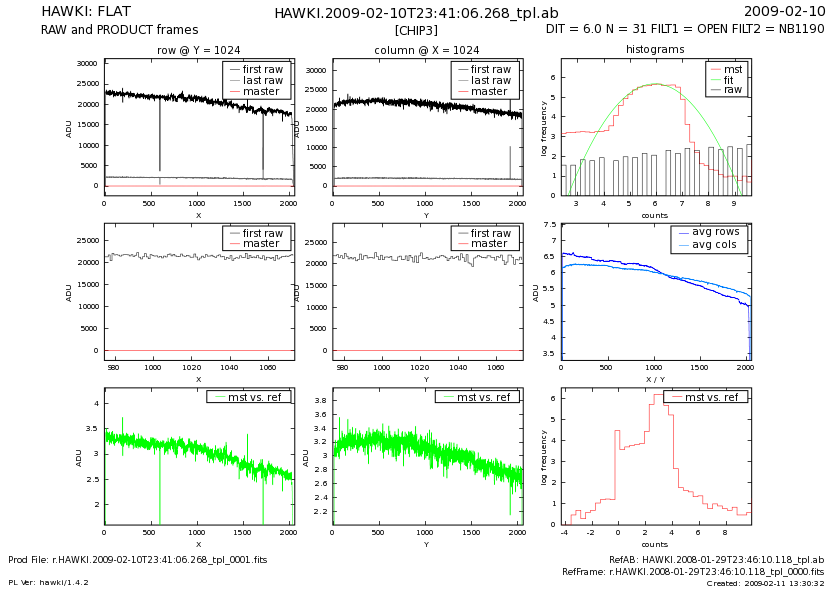
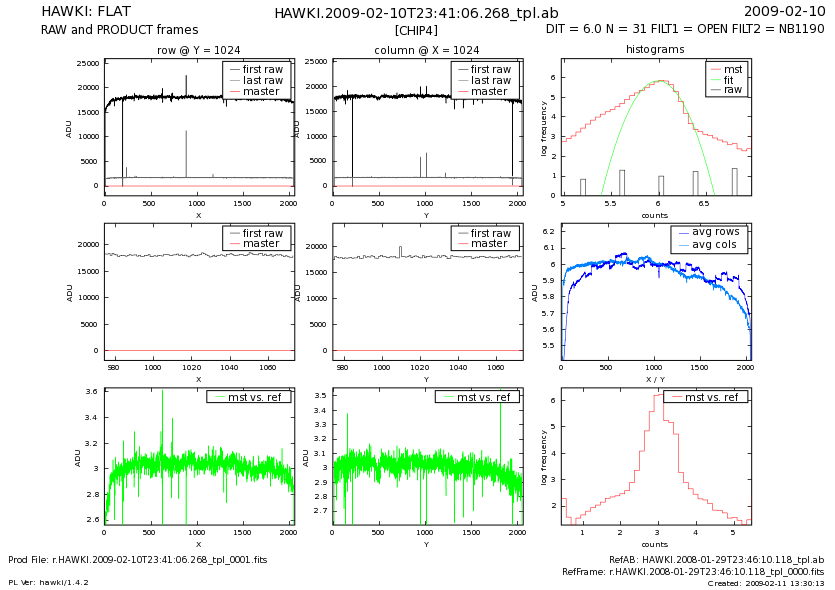
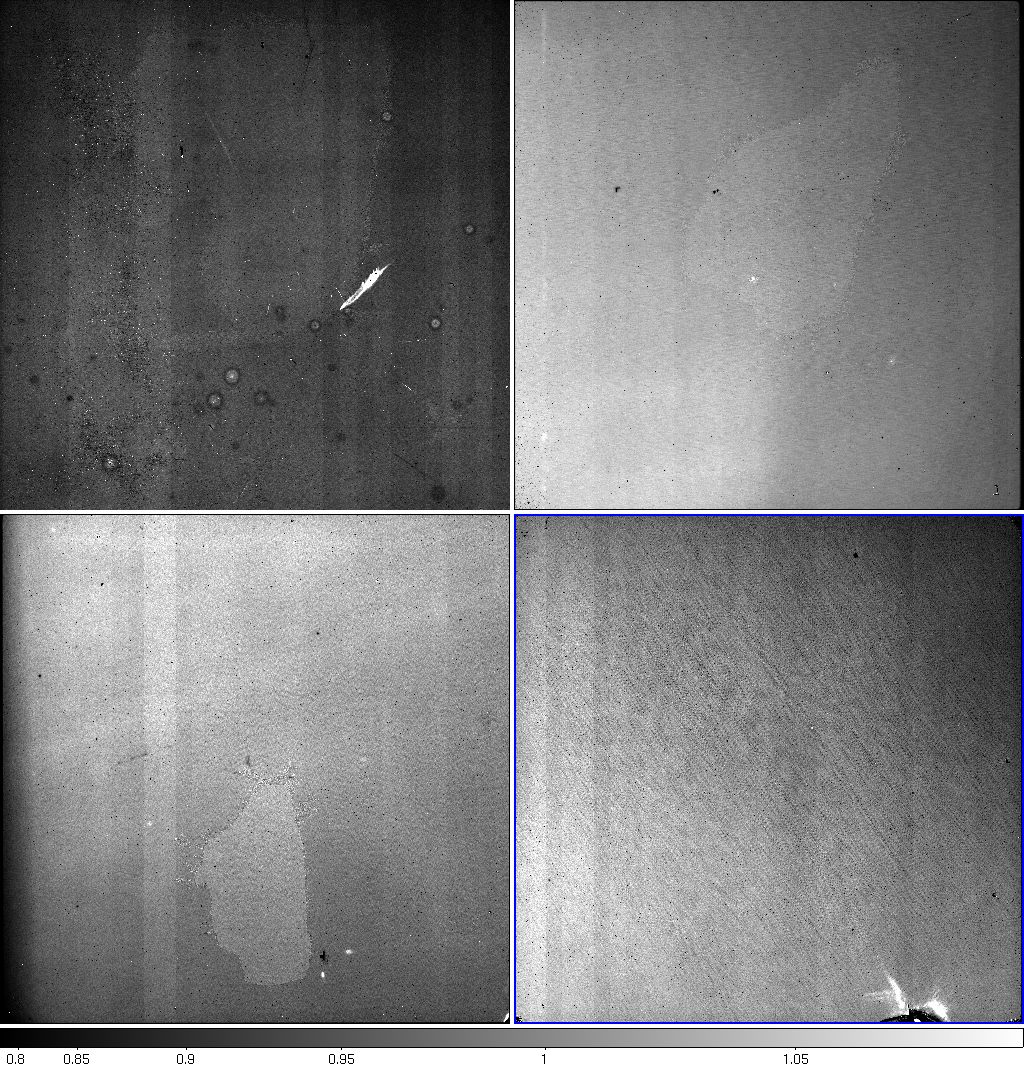
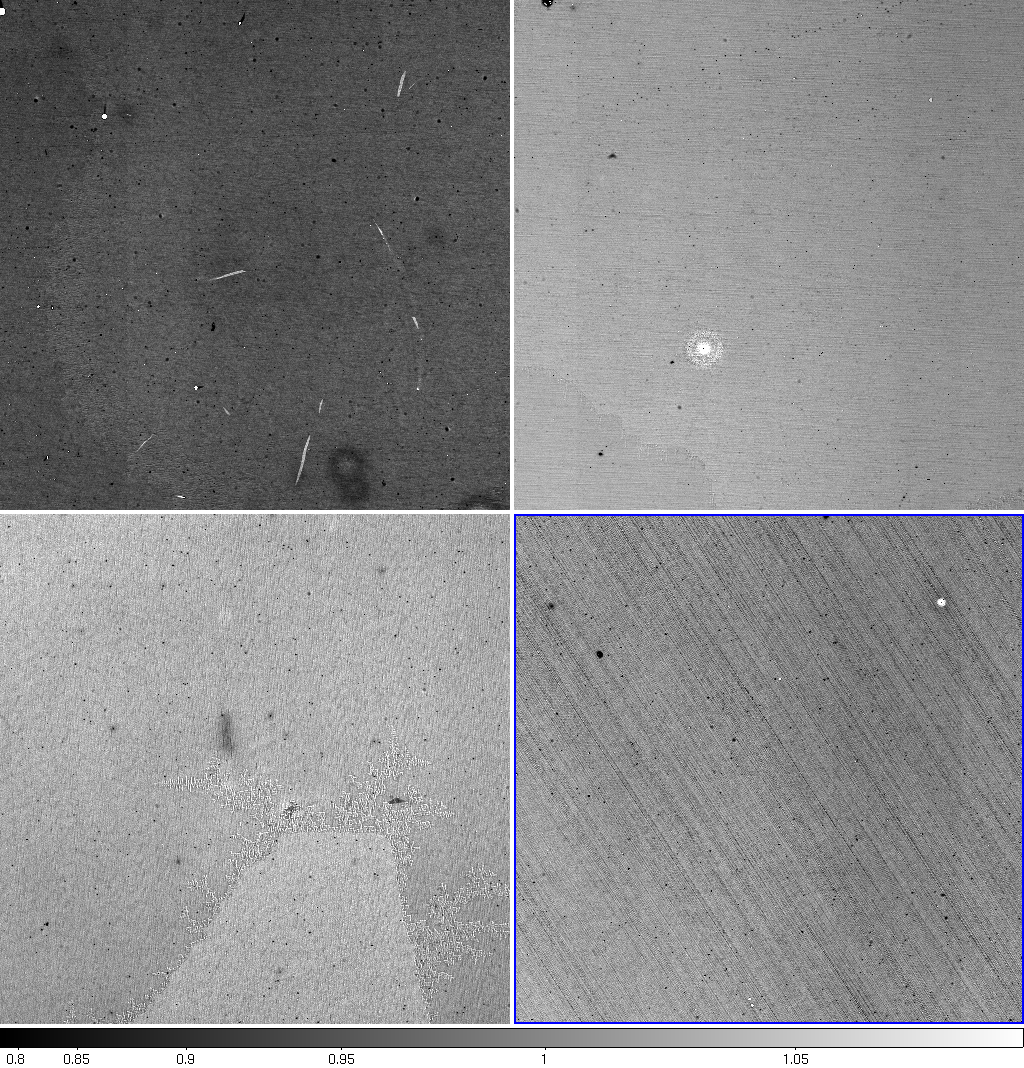
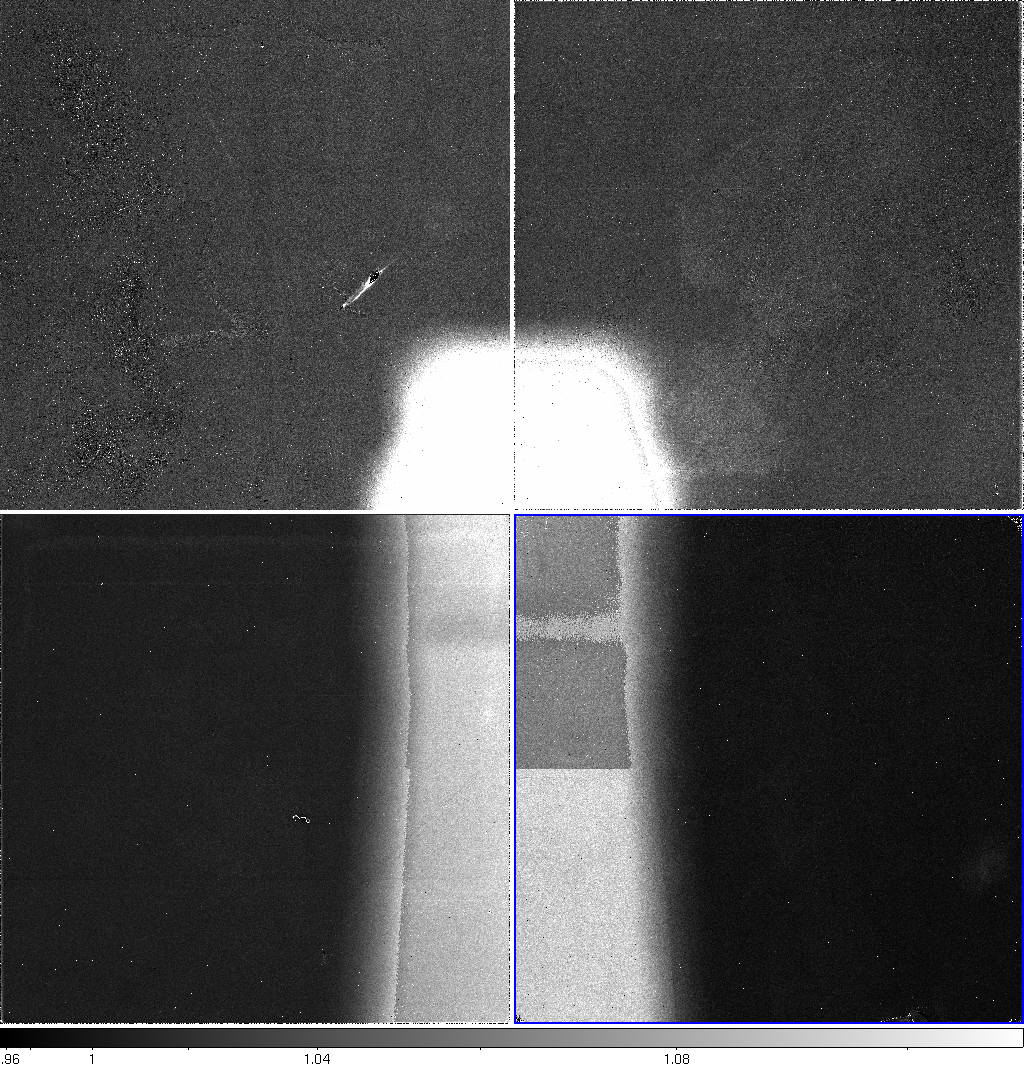
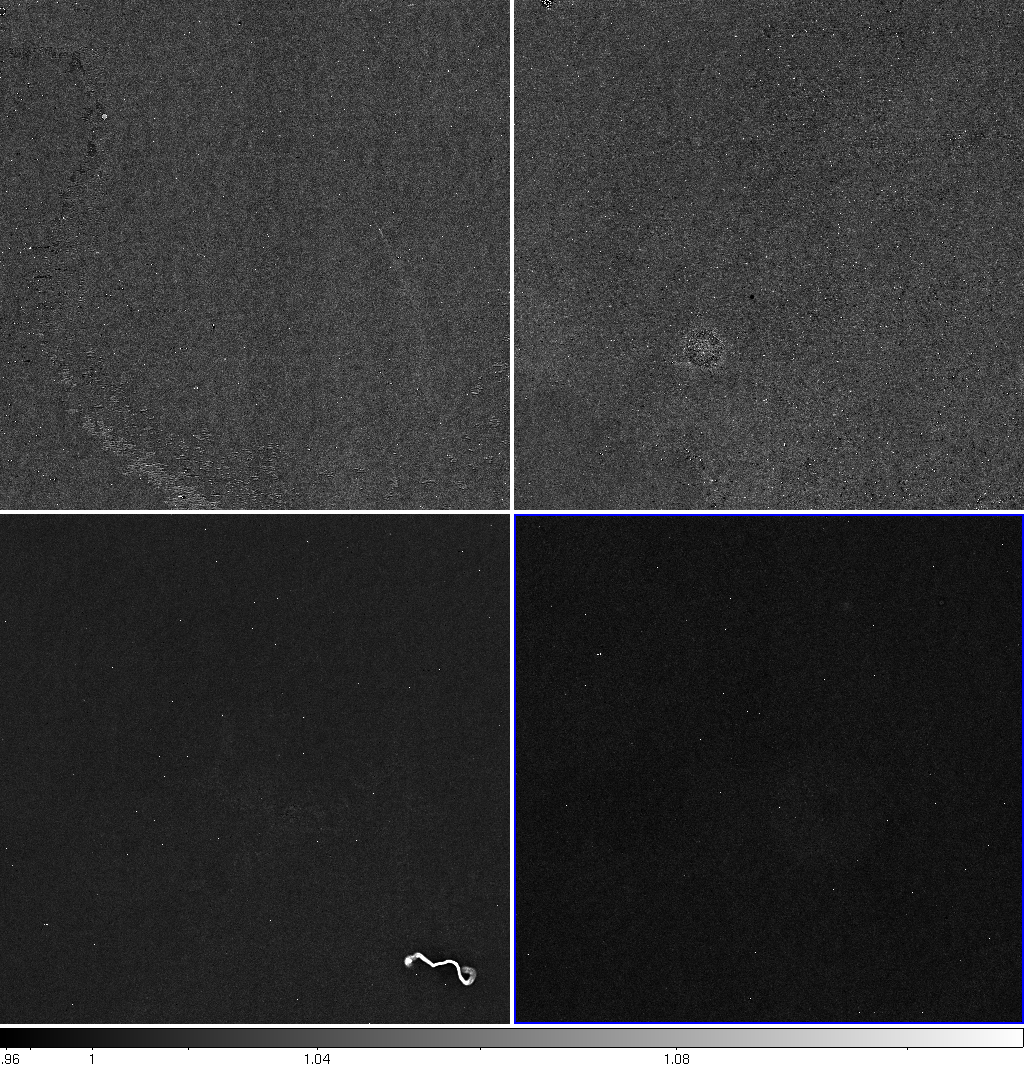
flat_plt_A_1.png So called 'Flux Growth Curves' (since the plot was first developed for twilight FLATs); The plot shows for each of the four detectors the median value and the standard deviation of each RAW frame in the stack. The four plots for each statistic are arranged in a 2x2 grid replicating the physical layout of detectors. Medians are the left four, standard deviations are the right four. Statistics are taken from the FLAT_STATS product produced by the pipeline. The AB name (top middle), night date (top right), product name (bottom left), reference AB and reference frame (bottom right), DIT, NDIT and DATNCOM (top right), pipeline version (bottom left) and creation date (bottom right) are all documented. flat_plt_A_2.png Odd/Even COLUMN and ROW effects; The plot shows for each of the four detectors the: Top left four plots): Odd/Even Column median statistics, each plotted point is the mean value of odd columns over even columns Top right four plots): Odd/Even Column standard deviation statistics, each plotted point is the standard deviation of odd columns over even columns Bottom left four plots): Odd/Even Row median statistics, each plotted point is the mean value of odd rows over even rows Bottom right four plots): Odd/Even Row standard deviation statistics, each plotted point is the standard deviation of odd rows over even rows flat_plt_1_1.png Standard pyqc mstplt report for Q1 consisting of: subplot#1: plots across one row for the first and last RAW frames in the stack and the master. The row plotted is specified as centrow in config_flat.py subplot#2: plots across one column for the first and last RAW frames in the stack and the master. The row plotted is specified as centcol in config_flat.py subplot#3: Histograms of pixel values for the first RAW frame of the stack, the master, and a gaussian fit to the master. subplot#4: zoom plots across one row for the first and last RAW frames in the stack and the master. The row plotted is specified as xcentrange in config_flat.py subplot#5: zoom plots across one column for the first and last RAW frames in the stack and the master. The row plotted is specified as ycentrange in config_flat.py subplot#6: Averages of all columns and all rows of the master subplot#7: plots across one row for the difference of the master and the reference master. The row plotted is specified as centrow in config_flat.py If no reference is found this plot is not shown. subplot#8: plots across one column for the difference of the master and the reference master. The row plotted is specified as centcol in config_flat.py If no reference is found this plot is not shown. subplot#9: Histogram of pixel values for the difference of the master and the reference master. If no reference is found this plot is not shown. flat_plt_2_1.png Standard pyqc mstplt report for Q2 as for Q1 flat_plt_3_1.png Standard pyqc mstplt report for Q3 as for Q1 flat_plt_4_1.png Standard pyqc mstplt report for Q4 as for Q1 flat_ima_A_1.png full display of master frame (graphic created by hawki.ds9Im script run by hawki_flat.py but can be run standalone also) flat_ima_A_2.png closeup of central region of each chip of master frame (graphic created by hawki.ds9Im script run by hawki_flat.py but can be run standalone also) flat_ima_A_3.png full display of difference between master frame and Reference master frame (graphic created by hawki.ds9Im script run by hawki_flat.py but can be run standalone also) flat_ima_A_4.png closeup of central region of each chip of difference between master frame and Reference master frame (graphic created by hawki.ds9Im script run by hawki_flat.py but can be run standalone also) | |||||||||||||||||||||||||||
| QC1PARAM |
QC1 parameters written into QC1 table: QC1db names: qc_flat_norm | qc_flat_medmin | qc_flat_medmax | qc_flat_medmean | qc_flat_medmed | qc_flat_medstdev | qc_flat_nbadpix FITS key names: QC.FLAT.NORM | QC.FLAT.MEDMIN | QC.FLAT.MEDMAX | QC.FLAT.MEDMEAN | QC.FLAT.MEDMED | QC.FLAT.MEDSTDEV | QC.FLAT.NBADPIX QC1 params created by pipeline: all QC1 params created by this procedure: none | |||||||||||||||||||||||||||
| ALGORITHM |
Description of algorithms: TBD... | |||||||||||||||||||||||||||
| CERTIF |
Reasons for rejection:
| |||||||||||||||||||||||||||
| COMMENTS | None | |||||||||||||||||||||||||||
| top | [2015-11-05T15:10:09] created by qcDocu v1.1.2, a tqs tool | |||||||||||||||||||||||||||