9. Logging
Revision: |
1.8 |
|---|---|
Status: |
Released |
Repository: |
|
Project: |
ELT CII |
Folder: |
trunk/deliverables/phase10 |
Document ID: |
CSL-DOC-20-181435 |
File: |
MAN-ELT_Log.docx |
Owner: |
Rodrigo Fernández Rodríguez |
Last modification: |
March 14, 2022 |
Created: |
July 5, 2019 |
Prepared by |
Reviewed by |
Approved by |
|---|---|---|
Rodrigo Fernández Rodríguez (CSL) |
Borut Terpinc (CSL SWE) Jan Pribošek (CSL SWE) |
Gregor Čuk (CSL) |
Revision |
Date |
Changed/rev iewed |
Section(s) |
Modificatio n |
|---|---|---|---|---|
0.1 |
25.02.2020 |
rfernandez |
All |
Document creation. |
1.0 |
06.05.2020 |
rfernandez/ bterpinc |
All |
Updated all sections and added tracing. Final review. |
1.1 |
11.09.2020 |
dkumar |
9.2.3 9.2.2.2 9.2.3 |
Tracing changes. New heading 9.2.3. |
1.2 |
28.09.2020 |
rfernandez |
All |
Updates after LAT topical review |
1.3 |
28.09.2020 |
dkumar |
9.2.4 9.2.3 |
OLDB Context propagation . Mal pub/sub examples. |
1.4 |
29.09.2020 |
rfernandez |
4.8 5 |
Rearranged TOC structure. Moved String formatting and CLI tool sections |
1.5 |
15.10.2020 |
rfernandez |
2, 8.1 6.1.1 8.2.1.1, 8.2.1.2 |
Added “separation ” between logging and tracing. Added description of Filebeat multiline options. New chapters added. |
1.6 |
01.12.2020 |
rfernandez |
4 |
Fixed inconsisten cies in C++ example executables names |
1.7 |
27.01.2021 |
rfernandez |
2, 4, 6 , 7.1 |
Replaced usages of INTROOT with CIISRV_ROOT |
1.8 |
14.03.2022 |
mschilli |
5, 6, 7 |
logSend(5) now part of Tools(now 6) Added ciiLogViewer |
Confidentiality
This document is classified as a confidential document. As such, it or parts thereof must not be made accessible to anyone not listed in the Audience section, neither in electronic nor in any other form.
Scope
This document is manual for the CII Logging system.
Audience
This document is aimed at those Cosylab and ESO employees involved with the ELT Core Integration Infrastructure Software project, as well as other Users and Maintainers of the ELT Core Integration Infrastructure Software.
Glossary of Terms
API |
Application Programming Interface |
|---|---|
CII |
Core Integration Infrastructure |
MAL |
Middleware Abstraction Layer |
OLDB |
Online Database |
EA |
Engineering Archive |
CLI |
Command Line Interface |
GUI |
Graphical User Interface |
ES |
Elasticsearch |
FB |
Filebeat |
LS |
Logstash |
JSON |
JavaScript object notation |
SVN |
Subversion |
XML |
Extensible Markup Language |
YAML |
YAML Ain’t Markup Language |
TTL |
Time-To-Live |
References
ESO, Core Integration Infrastructure Requirements Specification, ESO-192922 Version 7
Cosylab, ELT CII Log Transfer Document, CSL-DOC-20-181435, Version X.X
Cosylab, ELT CII Error handling Manual Document, CSL-DOC-20-181435, Version X.X
Python logging, https://docs.python.org/3/library/logging.html
Logstash Monitoring APIs: https://www.elastic.co/guide/en/logstash/6.8/monitoring.html
Filebeat HTTP Monitoring endpoint: https://www.elastic.co/guide/en/beats/filebeat/6.8/http-endpoint.html
Logstash-to-Logstash Communication, https://www.elastic.co/guide/en/logstash/6.8/ls-to-ls.html
Logstash Settings File, https://www.elastic.co/guide/en/logstash/6.8/logstash-settings-file.html
Log4j2 Async Logging, https://logging.apache.org/log4j/2.x/manual/async.html
Logstash Reference, https://www.elastic.co/guide/en/logstash/6.8/index.html
Filebeat Reference, https://www.elastic.co/guide/en/beats/filebeat/6.8/index.html
Elasticsearch Reference, https://www.elastic.co/guide/en/elasticsearch/reference/6.6/index.html
Kibana User Guide, https://www.elastic.co/guide/en/kibana/6.6/index.html
Logtrail, https://github.com/sivasamyk/logtrail
Checker Framework, https://checkerframework.org/
Kibana Index Patterns, https://www.elastic.co/guide/en/kibana/6.8/index-patterns.html
Lucene Query Syntax, https://www.elastic.co/guide/en/kibana/6.8/lucene-query.html
Log4cplus logging macros, https://log4cplus.sourceforge.io/docs/html/loggingmacros_8h_source.html
Elasticsearch cross-cluster search, https://www.elastic.co/guide/en/kibana/6.6/management-cross-cluster-search.html
OpenTracing API docs, https://opentelemetry.io/docs/
Jaeger Tracing docs, https://www.jaegertracing.io/docs/1.17/
Jaeger Client Libraries, https://www.jaegertracing.io/docs/1.17/client-libraries/
Jaeger Trace Adjusters, https://pkg.go.dev/github.com/jaegertracing/jaeger/model/adjuster
9.1. Overview
This document is a user manual for usage of CII Logging and tracing systems. It explains how to use the Logging Client API through ELT CII common library and GUI Applications to interact with it. It also explains how to use the different services that comprise the distributed logging CII system.
All examples in this manual are also presented in SVN code (project logging-examples).
9.2. Introduction
CII Log provides the logging and tracing services of the Control System. Logging pertains to all aspects of CII services. Its purpose is to provide basic and detailed information of the different services and systems in the CII in order to have a better understanding of the behaviour of the distributed system, and in particular to troubleshoot the system in case of problems. Figure 2‑1 shows how the CII Log Service interacts with other elements of the ELT Core Integration Infrastructure. Logging is considered a basic service and doesn’t use any other CII service.
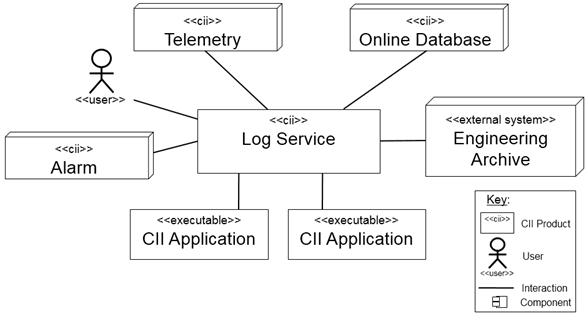
Figure 2‑1 Log interaction
CII Log system components can be divided into four subcomponents according to their responsibilities:
Client APIs
Transmission and Management
Persistence
Data visualization
Figure 2‑2 Standard workflow of CII Log system shows the standard workflow between the different parts of the CII Log system, and the elements that comprise each of the sub-parts.
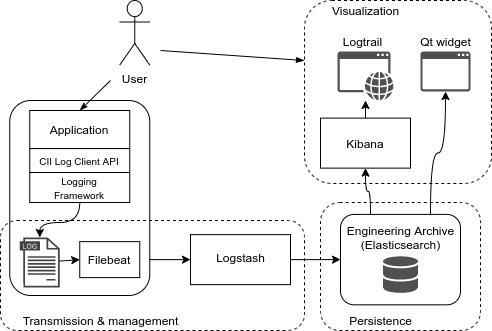
Figure 2‑2 Standard workflow of CII Log system
The CII Log Client API enables users to produce log messages from their applications using Logger objects (see 2.2). These messages are produced as strings and follow a predefined format defined in the CII Logging library (see 2.3). The API leverages on existing logging frameworks and extends them in order to provide all CII functionalities. The logging frameworks it leverages on are:
Log4j (Java) [4]
Log4cplus (C++) [5]
Python logging (Python) [6]
Filebeat [13] and Logstash [12] are used as transmission and management services. A Filebeat instance is responsible for harvesting CII logs from a single host (see 2.1). This log message is then wrapped as JSON format and sent to a Logstash instance.
The serialized message is not parsed to the individual log fields yet, as this is the responsibility of the Logstash instance that first receives the unparsed log event.
Apart from extracting all the CII Log fields (see Appendix B), Logstash is responsible for persisting log events to an Elasticsearch cluster, forwarding them to another Logstash instance, and/or outputting them to a file or console. In addition to this, it allows for further management and routing of the serialized log events.
Elasticsearch [14] is used as persistence backend, allowing for remote storage of log events. It is part of the same software stack as Filebeat and Logstash, therefore it provides a seamless integration of the Engineering archive with the CII Log transmission and management subsystem.
Kibana [15] with Logtrail plugin [16], as well as a Qt GUI and widget are used as visualization tools for querying and browsing CII logs.
Tracing is separated from logging, as it serves a different purpose. Tracing is explained in detail in section 8.
9.2.1. Logsink directory
In order to enable the CII Logging transmission and management subsystem to collect logs produced at a host using the CII Log Client API, a logsink directory is used. This directory is located in $CIISRV_ROOT/logsink, and any log file created here will be harvested by a Filebeat instance, if available on the host.
It is the responsibility of the system administrator to ensure that old unused log files are deleted regularly from the logsink directory. A cron job that periodically deletes log files that haven’t been modified for a certain amount of time can be used for this purpose.
9.2.2. Loggers and Appenders
The architecture of the three used logging frameworks is relatively similar. The main elements of this architecture are the loggers, the appenders, and the layouts.
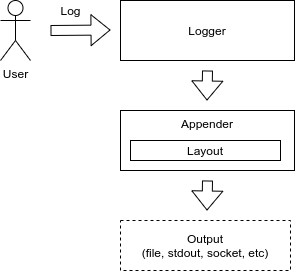 While the loggers are the elements responsible for exposing
the API to create log events, appenders are responsible for writing
those events to the appropriate outputs, whether it is stdout, a file, a
database, a socket, or any other.
While the loggers are the elements responsible for exposing
the API to create log events, appenders are responsible for writing
those events to the appropriate outputs, whether it is stdout, a file, a
database, a socket, or any other.
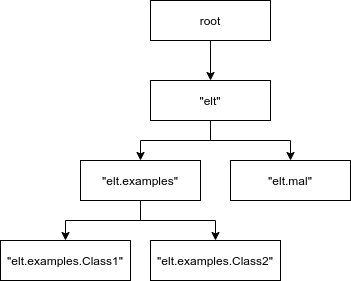
Loggers are organized in a named hierarchical structure in a parent-child relationship fashion. Each logger has a name with dot-separated components, which indicates the position of the logger in the hierarchy. An example hierarchy is shown in Figure 2‑4.
There must always be a root logger with an empty name.
Appenders are attached to loggers. Each logger can have one or more appenders attached, and the same appender can be attached to multiple loggers.
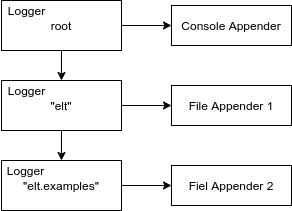
Figure 2‑5 Loggers and Appenders example
Another possible scenario is having multiple child loggers with no appenders attached, having the appenders attached only to the root/parent logger. This can be useful to handle logs from different classes or packages through the child loggers but leveraging the output of those log messages to the parent/root logger and its appenders.
9.2.3. Log Layouts
Log layouts are components of the logging libraries responsible for serializing a log event into the format that will be output by the appenders, usually a string.
CII Logging library provides two different layouts that produce plain strings according to the CII Log format:
CiiLayout
CiiSimpleLayout
The CiiLayout is intended both for human and machine consumption, and it must be used for logs written to the logsink directory (see 2.1). It contains the fields described in Appendix B, in the same order as shown there.
The CiiSimpleLayout is a simplified version and is intended for human consumption. It is composed of the date and time of the log event, the log type, a log ID, the message and all the optional fields described in Appendix B.
Additional details and usage instructions can be found in section 4.4.
Example log messages using both the CiiLayout and the CiiSimpleLayout are included in section 4.5 as well as examples how to use it in configurations are included in section 4.3.
Appendix B describes the fields of which a CII log is composed. All optional fields can be added to the log message using the CII Log Client API. See section 4.7 for further details.
TraceID and SpanID are used to log information about the current tracing context (see section 8).
ErrorTypeName, ErrorDateTime, ErrorMessage, and ErrorTrace are used to log a formatted CiiException.
9.2.4. Postmortem buffer
CII Log Client API offers a logs postmortem buffer facility. It enables users to obtain on demand logging information that otherwise would have been lost due to filtering by the active logging configuration.
The postmortem buffers stores produced log events for all logging levels, regardless of the filtering configurations of the loggers and appenders.
This buffer is time-bound. Events are evicted after a defined time is elapsed. The time-to-live (TTL) for the buffered log events can be configured by the user.
The flushing of this buffer is triggered on demand through the CII Log Client API. When this happens, the buffered events are flushed to the appropriate destinations.
By default, this buffer is disabled. Configuration and usage instructions can be found in section 4.8.
9.3. Prerequisites
This section describes the prerequisites for using the CII Logging libraries and applications. Note that the preparation of the environment (i.e. installation of required modules, configuration, running of services) is not in the scope of this document. Consult your administrator and the Log TRD document for information on how to establish the environment for usage of CII Logging libraries and applications.
9.3.1. WAF Modules
For using the CII Logging and tracing libraries and CLI tools, the following modules must be built and installed with WAF in the specified order:
MAL, (elt-mal)
Client APIs (client-api)
For using the Logging Qt GUI application and Logging Qt widgets, in addition to the above, the following module must be built and installed:
Qt Widgets library (elt-qt-widgets)
9.3.2. Services
This section describes the services used by logging. These services should be managed and maintained by system administrators. For details on how to use the CII Log Client API, skip to section 3.3.
9.3.2.1. Logging Services
The services described below are used for transmission, management, persistence, and querying of distributed CII logs. It must be noted that they are not necessary in order to use the Logging Client API.
Distributed CII Logging management is handled using the Elastic stack, which is comprised of the following components:
Filebeat [13]
Logstash [12]
Elasticsearch [14]
Kibana [15]
9.3.2.1.1. Filebeat
Filebeat is a lightweight log harvester and shipper service. It is used by CII Logging system to collect logs produced by applications using the CII Log Client API. Each host producing logs that need to be collected from logsink directory requires one properly configured instance of Filebeat running.
See the Log TRD document on how to set up the Filebeat service. Configuration instructions can be found in section 6.1.
9.3.2.1.2. Logstash
Logstash is a server-side data processing pipeline service. It is used by the CII Logging system to ingest and parse the log events sent by one or many Filebeat instances, or to receive the log events forwarded by another Logstash instance.
These log events can then be processed by any number of output handlers, such as handlers for persistence to an ref::Elasticsearch instance, forwarding to another Logstash instance, writing to a file, or to stdout. How the log events are passed to the Logstash outputs can be managed based on the log event properties, such as the level or the audience.
At least one instance of Logstash is necessary to process and persist the log events collected by the Filebeat instances.
See the Log TRD document on how to set up the Logstash service. Configuration instructions can be found in section 6.2.
9.3.2.1.3. :: _Elasticsearch:
Elasticsearch is a RESTful distributed document-oriented database and a search and analytics engine. It is used by CII Logging system as a persistence database for logs produced using the CII Log Client API in the distributed system.
It is required to have at least one Elasticsearch instance to be able to persist the log events.
See the Log TRD document on how to set up the Elasticsearch service.
9.3.2.1.4. Kibana
Kibana is a frontend application that provides search and data visualization capabilities for data indexed in Elasticsearch. Kibana is used by CII Logging system, together with the Logtrail plugin [16], in order to allow users to query and browse persisted CII logs.
At least one Kibana instance must be available for the user to be able to browse the persisted logs. Each Kibana instance is configured to use one Elasticsearch instance or cluster. It is also possible to configure a Kibana instance to query to other remote Elasticsearch clusters.
See the Log TRD document on how to set up the Kibana service and the Logtrail plugin. Configuration instructions for Kibana and the Logtrail plugin can be found in section 7.2.
9.3.3. Includes/Imports
For basic usage of the Logging library, the user needs the CiiLogManager class. This class contains the API for interacting with the underlying Logging framework using the CII Log extensions, whether it’s Log4j (Java), Log4cplus (C++), or Python logging.
It provides methods for configuring the logging system, getting a Logger object, or flushing the postmortem buffer. Detailed API per language is provided in Appendix A. Additional details can be found in section 4.1.
In addition, the language-specific Logger and Level classes shall be imported. Level class is not necessary if convenience log methods for the different levels are used, such as debug(“message”) instead of log(Level.DEBUG, “message”).
C++ also needs to include ciiException class, since the ciiLogManager configuration methods can throw an exception in case of an error during configuration initialization.
For more advanced use, it is necessary include the CiiLogMessageBuilder class. The CiiLogAudience enum must be imported as well if Audience field value is provided. Also, the appropriate CiiException class must be imported.
These includes, in addition to linked libraries, are shown in the example code in logging-examples module.
9.3.3.1. Java
import org.apache.logging.log4j.Logger;
import org.apache.logging.log4j.Level;
import elt.log.CiiLogManager;
import elt.log.CiiLogMessageBuilder:
import elt.log.CiiLogAudience;
import elt.log.layout.CiiSimpleLayout;
import elt.log.layout.CiiLayout;
9.3.3.2. C++
#include <log4cplus/loggingmacros.h>
#include <ciiLogManager.hpp>
#include <ciiLogMessageBuilder.hpp>
#include <ciiLogConfigurator.hpp>
#include <ciiLogAudience.hpp>
#include <ciiException.hpp>
9.3.3.3. Python
import logging
from elt.log import CiiLogManager
from elt.log import CiiLogMessageBuilder
from elt.log import CiiLogAudience
9.4. Logging Library Usage
This section describes the CII Logging Client API, and explains through examples how to configure and use the CII Logging API library in an application.
The CII Log Client API is split between two classes. The CiiLogManager and the CiiLogMessageBuilder.
Because of the fact that Cii Log Client API leverages on different libraries for Java (Log4j), C++ (Log4cplus) and Python (Python logging), and the constraints this imposes due to the different implementations and APIs, the CII Log client API methods signatures vary across languages and some methods are only available for certain languages.
A complete description of the CII Log Client API for Java, C++, and Python can be found in Appendix A.
9.4.1. CiiLogManager
This is the main class of the CII Log Client API. It provides static methods for configuring and initializing the application’s logging, retrieving, creation of logger objects used to log messages, or flushing of the post-mortem appender.
The loggers retrieved using the CiiLogManager are used according to the APIs of the specific logging frameworks for each language [4][5][6].
9.4.2. CiiLogMessageBuilder
The CiiLogMessageBuilder is aimed at helping users to create correctly formatted log messages with extended information, such as:
Audience
Tracing context
CII Error messages
User-defined log ID
See section 4.7 for usage details and examples.
9.4.3. Logging Configuration
Each of the three logging libraries CII Log Client API provides different ways of configuration. The following sections explain how logging is configured for Java, C++, and Python.
If logging is initialized without providing any custom configuration, a default configuration will be used. This configuration will have:
A root logger configured to an ERROR level with two appenders attached.
An stdout appender using a CiiSimpleLayout layout.
A rolling file appender to logsink directory using a CiiLayout. This appender logs to a file with the name eeltdev-output-{timestamp}.log and rotated files with file names following the pattern eeltdev-output-{timestamp}.%i.log, where %i is the index of the rotated file.
If using default configuration, logs will be output to console and logsink directory only if $CIISRV_ROOT environment variable is defined, otherwise logs will be only written to console and warning will be issued to the user.
Examples of default configuration files for Log4j, Log4cplus, and Python are shown in sections 4.3.1, 4.3.2, and 4.3.2.
It is relevant to notice the default path for any file creation or search is the compilation folder generated when the ‘waf build’ command is called. So any developer string containing a specific path file should be relative to the project build directory.
9.4.3.1. Java
Due to extensions to the Log4j library, only a subset of the configuration options is supported when using CII Log Client API. There is no support for configuring logging using Log4j’s ConfigurationBuilder.
The following file configuration options are available:
XML
Properties
JSON
YAML
By default, Log4j will look for a file called log4j2.xml in the classpath. If this file is not found, it will fall back to the default CII logging configuration. If there’s any issue creating the default CII configuration, it will fall back to the default Log4j configuration, which consists of a root logger with an ERROR level and a console appender attached to it.
It is possible to specify which configuration file will be loaded by Log4j by setting the system property log4j.configurationFile to the path of the configuration file.
It can be passed as a command line argument as:
-Dlog4j.configurationFile=path/to/log4j2configFile.xml
Or set at runtime before Log4j has been initialized:
System.setProperty(“log4j.configurationFile”, “path/to/log4jconfigFile.xml”)
It is also possible to initialize a custom configuration dynamically using the Log4j Configurator class:
Configurator.initialize(“configuration_name”, “path/to/log4jconfigFile.xml”)
Below it is shown how an XML with a configuration equivalent to the default CII configuration would like.
Listing 4‑1 Example Java default configuration
<?xml version="1.0" ?>
<Configuration name="1584706371399" status="WARN">
  <Appenders>
    <Console name="ConsoleAppender" target="SYSTEM_OUT">
      <CiiSimpleLayout/>
    </Console>
    <RollingFile name="FilesinkFileAppender" append="true"
  createOnDemand="true"
  fileName="${env:CIISRV_ROOT}/logsink/eeltdev-output-1584706371399.log"
  filePattern=
        "${env:CIISRV_ROOT}/logsink/eeltdev-output-1584706371399.%i.log">
      <Policies>
        <SizeBasedTriggeringPolicy/>
      </Policies>
      <CiiLayout/>
    </RollingFile>
  </Appenders>
  <Loggers>
    <Root level="ERROR" includeLocation="true">
      <AppenderRef ref="ConsoleAppender"/>
      <AppenderRef ref="LogsinkFileAppender"/>
    </Root>
  </Loggers>
</Configuration>
Note the use of CiiLayout and CiiSimpleLayout. These are loaded as plugins by Log4j on initialization. It is required for this to work as intended that class CiiLogManager is loaded by the classloader before Log4j is initialized. CII Log layouts are described in more detail in section 4.4.
To troubleshoot the initialization, it is possible to enable the debug level on the internal Log4j StatusLogger by setting system property log4j2.debug. If this property is set, Log4j will output its internal logs to console.
-Dlog4j2.debug=true
9.4.3.2. C++
In addition to the default configuration, the CII Log Client API provides support for custom configuration of the Log4cplus logging framework. Two configuration options are available:
Properties object
Properties file
The CiiLogManager class offers methods that can take either an object or a file containing Log4cplus configuration options. It also provides a method without arguments that uses the default CII configuration. Listing 4‑2 shows an example properties configuration equivalent to the default one.
Listing 4‑2 Example C++ default configuration
log4cplus.appender.ConsoleAppender=log4cplus::ConsoleAppender
log4cplus.appender.ConsoleAppender.layout= elt::log::layout::CiiSimpleLayout
log4cplus.appender.LogsinkFileAppender=log4cplus::RollingFileAppender
log4cplus.appender.LogsinkFileAppender.File=
                 ${CIISRV_ROOT}/logsink/eeltdev-output-1584706371399.log
log4cplus.appender.LogsinkFileAppender.layout=elt::log::layout::CiiLayout
log4cplus.rootLogger=ERROR, ConsoleAppender, LogsinkFileAppender
Detailed CiiLogManager API can be found in Appendix A.
9.4.3.3. Python
Three configuration modes are supported:
Default CII Log configuration
Custom dictionary-based configuration
Custom file configuration
If a file configuration is used, the file should contain the equivalent to a dictionary based configuration.
In Listing 4‑3 an example of a configuration equivalent to the default configuration can be seen.
Listing 4‑3 Example Python default configuration
'version': 1,
'cii_log_buffer': {
    'enabled': False,
    'ttl_ms': 60000
},
'handlers': {
    'cii-logsink': {
        'class': 'logging.handlers.RotatingFileHandler',
        'filename': ${CIISRV_ROOT}/logsink/eeltdev-output-1584706371399.log,
        'maxBytes': 10 * 1024 * 1024,
        'backupCount': 5,
        'formatter': 'cii'
    },
    'cii-console': {
        'class': 'logging.StreamHandler',
        'formatter': 'cii-brief',
        'stream': 'ext://sys.stdout',
        'level': 'ERROR'
    }
},
'root': {
    'level': 'ERROR',
    'handlers': ['cii-logsink', 'cii-console']
}
Detailed API can be found in Appendix A.
9.4.4. Log Layouts
Two CII Log Layouts are provided:
CiiLayout
CiiSimpleLayout
These layouts are described in section 2.3.
Examples on how to use the CII Log Layouts can be found in the configurations shown in section 4.3.
9.4.4.1. Java
The CII Log Layouts are provided as Log4j plugins, implemented by the classes CiiLayout and CiiSimpleLayout. They can be used as any other Log4j layout plugin. Usage example can be found in Listing 4‑1.
9.4.4.2. C++
The CII Log Layouts are provided as Log4cplus plugins, implemented by the classes CiiLayout and CiiSimpleLayout. They can be used as any other Log4j layout plugin. Usage example can be found in Listing 4‑2.
9.4.4.3. Python
To use the CII Log Layouts, the cii and cii-brief formatters can be used to enable the CiiLogLayout and the CiiSimpleLayout respectively. The definition of those formatters is injected in the configuration by the CiiLogManager configuration methods. Usage example can be found in Listing 4‑3.
9.4.5. Basic usage example with default configuration
The following examples show a basic usage workflow of the CII Logging API to produce log messages of different levels using a default CII configuration, as described in 4.3.
9.4.5.1. Java
The example shown in Listing 4‑4 can be run from the root directory of the logging-examples module with the run-logging-example-default-config provided script.
Listing 4‑4 Java basic example
public class LoggingBasicCustomExample {

    public static void main(String[] args) {

        /* Automatically initialize the logging framework and get the root
    * logger.
         * No configuration is provided so a default configuration is used.
         * This default configuration has two appenders: one that outputs to
         * stdout using CiiSimpleLogLayout, and another one that outputs to a
         * rolling file in $CIISRV_ROOT/logsink directory
         * Only log events of levels ERROR and FATAL will be output to the
         * appenders.
         */
        Logger rootlogger = CiiLogManager.getLogger("");

        /* Send INFO level message to root logger
         * This log will be discarded since the minimum log level for the root
         * logger is ERROR
         */
        rootlogger.log(Level.INFO, "First root logger message");

        /* Send ERROR level message to root logger
         * This log will be passed to the appenders for processing, since the
         * minimum log level for the root logger is ERROR
         */
        rootlogger.log(Level.ERROR, "Second root logger message");

        /* Get a logger with name 'elt.log.test'. There's no logger configured
         * with that name, therefore it will be created inheriting the
         * configuration of it's nearest ancester in the loggers named
         * hierarchy. In this case, since there is only root logger
         * configured, the configuration of the root logger will be used.
         */
        Logger logger = CiiLogManager.getLogger("elt.log.test");

        /* Send INFO level message to elt.log.test logger
         * This log will be discarded since the minimum log level is ERROR
         */
        logger.log(Level.INFO, "First elt.log.test logger message");

        /* Send ERROR level message to elt.log.test logger
         * This log will be passed to the appenders for processing, since the
         * minimum log level is ERROR
         */
        logger.log(Level.ERROR, "Second elt.log.test logger message");
    }
}
The logs output produced by this example would be the following in stdout:
2020-03-19T20:05:03.104+0100, ERROR, elt.LoggingBasicDefaultExample/main, Second root logger message
2020-03-19T20:05:12.571+0100, ERROR, elt.LoggingBasicDefaultExample/main, Second elt.log.test logger message
And in log file in logsink directory:
Cref=LoggingBasicDefaultExample.java-31, Date=2020-03-19T20:05:03.104+0100, HostName=docker-eso-eelt, LogType=ERROR, SourceID=elt.LoggingBasicDefaultExample/main, LogID=elt.log.CiiLogManager.main-31, Message=Second root logger message
Cref=LoggingBasicDefaultExample.java-49, Date=2020-03-19T20:05:12.571+0100, HostName=docker-eso-eelt, LogType=ERROR, SourceID=elt.LoggingBasicDefaultExample/main, LogID=elt.log.test.main-49, Message=Second elt.log.test logger message
9.4.5.2. C++
This example shown in Listing 4‑5 can be run with the $CIISRV_ROOT/bin/logging-example-app executable file installed by the logging-examples module.
Listing 4‑5 C++ basic example
int main(int ac, char *av[]) {
  try {
    /* Automatically initialize the logging framework and get the root logger.
     * No configuration is provided so a default configuration is used. This
     * default configuration has two appenders: one that outputs to stdout
     * using CiiSimpleLogLayout, and another one that outputs to a rolling
     * file in $CIISRV_ROOT/logsink directory
     * Only log events of levels ERROR and FATAL will be output to the
     * appenders.
    */
    log4cplus::Logger root_logger = ::elt::log::CiiLogManager::GetLogger();

    std::vector<log4cplus::SharedAppenderPtr> appenders = root_logger.getAllAppenders();
    for (const auto& appender: appenders) {
       std::cout << "Appender:" << appender->getName() << '\n';
    }

    /* Send INFO level message to root logger
     * This log will be discarded since the minimum log level for the root
     * logger is ERROR
     */
    root_logger.log(log4cplus::INFO_LOG_LEVEL, "First root logger message");

    /* Send ERROR level message to root logger
     * This log will be passed to the appenders for processing, since the
     * minimum log level for the root logger is ERROR
     */
    root_logger.log(log4cplus::ERROR_LOG_LEVEL, "Second root logger message");

    /* Get a logger with name 'elt.log.test'. There's no logger configured
     * with that name, therefore it will be created inheriting the
     * configuration of it's nearest ancester in the loggers named hierarchy.
     * In this case, since there is only root logger configured, the
     * configuration of the root logger will be used.
     */
    log4cplus::Logger logger = ::elt::log::CiiLogManager::GetLogger("elt.log.test");

    /* Send INFO level message to elt.log.test logger
     * This log will be discarded since the minimum log level is ERROR
     */
    root_logger.log(log4cplus::INFO_LOG_LEVEL,
                    "First elt.log.test logger message");

    /* Send ERROR level message to elt.log.test logger
     * This log will be passed to the appenders for processing, since the
     * minimum log level is ERROR
     */
    root_logger.log(log4cplus::ERROR_LOG_LEVEL,
                    "Second elt.log.test logger message");

    return 0;
  } catch (const ::elt::error::CiiException& ex) {
    std::cerr << "CiiException occured while executing sample code. What: "
      << ex.what() << '\n';
  }
  return -1;
}
This would produce the following output on stdout:
2020-04-19T21:49:41.894+0200, ERROR, root/140400261358272, Second root logger message
2020-04-19T21:49:41.894+0200, ERROR, root/140400261358272, Second elt.log.test logger message
And this one on the log file in logsink directory:
Cref=../cpp/logging-app/src/logging-app.cpp-35, Date=2020-04-19T21:49:41.894+0200, HostName=docker-eso-eelt, LogType=ERROR, SourceID=140400261358272, LogID=root.main-35, Message=Second root logger message
Cref=../cpp/logging-app/src/logging-app.cpp-53, Date=2020-04-19T21:49:41.894+0200, HostName=docker-eso-eelt, LogType=ERROR, SourceID=140400261358272, LogID=root.main-53, Message=Second elt.log.test logger message
9.4.5.3. Python
This example shown in Listing 4‑6 can be run with the $CIISRV_ROOT/bin/cii-logging-example-app-py executable file installed by the logging-examples module.
Listing 4‑6 Python basic example
def main():
    """
    Main application code
    @return status code, int
    """
    result = 0
    try:
        # Automatically initialize the logging framework and get the root
        # logger.
        # No configuration is provided so a default configuration is used.
        # This default configuration has two handlers: one that outputs to
        # stdout using elt.log.CiiLogConfigurator.CII_SIMPLE_LOG_PATTERN and
        # another one that outputs to a rolling file in $CIISRV_ROOT/logsink
        # directory.
        # Only log events of levels ERROR and FATAL will be output to the
        # handlers.
        root_logger = CiiLogManager.get_logger()

        # Send INFO level message to root logger
        # This log will be discarded since the minimum log level for the root
        # logger is ERROR
        root_logger.info("First root logger message")

        # Send ERROR level message to root logger
        # This log will be passed to the handlers for processing, since the
        # minimum log level for the root logger is ERROR
        root_logger.error("Second root logger message")

        # Get a logger with name 'elt.log.test'. There's no logger configured
        # with that name, therefore it will be created inheriting the
        # configuration of it's nearest ancestor in the loggers hirearchy. In
        # this case, since there is only root logger configured,
        # the configuration of the root logger will be used
        logger = CiiLogManager.get_logger("elt.log.test")

        # Send INFO level message to elt.log.test logger.
        # This log will be discarded since the minimum log level is ERROR
        logger.info("First elt.log.test logger message")

        # Send ERROR level message to elt.log.test logger
        # This log will be passed to the handlers for processings, since the
        # minimum log level is ERROR
        logger.error("Second elt.log.test logger message")
    except Exception as e:
        print('Exception occured while executing sample code: %s', e)
        result = 5
    return result
if __name__ == '__main__':
    sys.exit(main())
This would produce the following output on stdout:
2020-04-19T21:49:41.894+0200, ERROR, cii-logging-example-app-py/MainThread, Second root logger message
2020-04-19T21:49:41.894+0200, ERROR, cii-logging-example-app-py/MainThread, Second elt.log.test logger message
And this one on the log file in logsink directory:
Cref cii-logging-example-app-py.main-35, Date=2020-04-19T21:49:41.894+0200, HostName=docker-eso-eelt, LogType=ERROR, SourceID= cii-logging-example-app-py/MainThread, LogID=main-35, Message=Second root logger message
Cref= cii-logging-example-app-py.main-50, Date=2020-04-19T21:49:41.894+0200, HostName=docker-eso-eelt, LogType=ERROR, SourceID= cii-logging-example-app-py/MainThread, LogID=main-50, Message=Second elt.log.test logger message
9.4.6. Basic usage example with custom configuration
This section shows how the use a custom configuration. In this case, we have a configuration with two different loggers, and each logger has a different appender, as described in Table 4‑1.
Table 4‑1 Example loggers and appenders
Logger name |
Logger level |
Appender type |
|---|---|---|
“” (root) |
WARN |
File |
“elt.log.test” |
TRACE |
Console |
This configuration can be useful if, for example, we want to send all logs of severity WARN or higher to the logsink directory, but we are trying to troubleshot a bug in package elt.log.test, therefore we want logs of severity as low as TRACE to be output as well for that specific package.
In certain cases, it is necessary or useful for a developer to be able to change the existing logging configuration at runtime. In the C++ and Python cases, the respective log4cplus and Python logging APIs are unaffected by the CII Log extensions of those frameworks, and appropriate documentation on runtime configuration of the frameworks is available in their respective APIs documentation [4][5][6]. In the case of Java, due to the implementation details of the postmortem buffer, it is not possible to change levels or filters of the loggers or appenders if it is enabled. If the postmortem buffer is not enabled the Log4j API is unaffected and can be modified according to the Log4j API documentation [4]. More details on the limitations on the usage of the Log4 API are described in section 4.9.1.
The example code and configurations for each language and outputs produced by the examples from section 4.4 with these configurations are shown below. These examples can be also found in logging-examples module.
9.4.6.1. Java
The example shown in Listing 4‑7 uses the configuration shown in Listing 4‑8.
It can be run from the root directory of the logging-examples module with the run-logging-example-custom-config provided script.
Listing 4‑7 Java example app with custom configuration
public class LoggingBasicExampleCustomConfig {

    public static void main(String[] args) {

        /* Logging is initialized with custom configuration
    * custom-example-log4j2-config.xml located in resources directory.
         * This custom configuration has two loggers:
         *     - root: With a INFO level and a rolling file appender to
         *       $CIISRV_ROOT/logsink directory
         *     - "elt.log.test": With a TRACE level, a console appender, and
         *       additivity enabled
         *
         * It is also possible to provide the path of the configuration file
         * as system property log4j.configurationFile. This can be achieved
         * passing it as an argument when running the application:
         *     $ java -Dlog4j.configurationFile=<path/to/config/file>
         * Or setting it programmatically before Log4j is initialized:
         *     System.setProperty(
         *            "log4j.configurationFile", "path/to/config/file");
         */
        Configurator.initialize("custom-config",
               "java/src/resources/custom-example-log4j2-config.xml");

        /* Get the root logger.
         */
        Logger rootlogger = CiiLogManager.getLogger("");

        /* Send INFO level message to root logger
         * This log will be output to the log file in logsink directory
         */
        rootlogger.log(Level.INFO, "First root logger message");

        /* Send TRACE level message to root logger. This log message will be
         * discarded due to the root logger having a threshold level of WARN
         */
        rootlogger.log(Level.TRACE, "Second root logger message");

        /* Get a logger with name 'elt.log.test'
         */
        Logger logger = CiiLogManager.getLogger("elt.log.test");

        /* Send TRACE level message to elt.log.test logger
         * This log will be output to console since the minimum log level is
         * TRACE.
         * It will be also passed to its parent logger (root) since additivity
         * property of this logger is set to true. The root logger will accept
         * it also, despite of its level being set to INFO. This is due to the
         * fact that the logger level threshold is only checked at the logger
         * where the message is created. If a threshold level would be set to
         * on the appender attached to the root logger, that one would be
         * applied.
         */
        logger.log(Level.TRACE, "First elt.log.test logger message");

        /* Send ERROR level message to elt.log.test logger
         * This log will be output to console since the minimum log level is
         * TRACE. It will be also passed to its parent logger (root) since
         * additivity property of this logger is set to true. The root logger
         * will also pass it to the logsink file appender.
         */
        logger.log(Level.ERROR, "Second elt.log.test logger message");
    }
}
Listing 4‑8 Log4j custom configuration
<Configuration status="WARN">
  <Appenders>
    <Console name="Console" target="SYSTEM_OUT">
      <CiiSimpleLayout/>
    </Console>
    <RollingFile name="FileLogsink" append="true"
      createOnDemand="true"
      fileName="${env:CIISRV_ROOT}/logsink/custom-example.log"
      filePattern=" ${env:CIISRV_ROOT}/logsink/custom-example.%i.log">
      <Policies>
        <SizeBasedTriggeringPolicy/>
      </Policies>
      <CiiLayout/>
    </RollingFile>
  </Appenders>
  <Loggers>
    <Logger name="elt.log.test" level="TRACE" additivity="true">
      <AppenderRef ref="Console"/>
    </Logger>
    <Root level="INFO">
      <AppenderRef ref="FileLogsink"/>
    </Root>
  </Loggers>
</Configuration>
This configuration would produce the following output on console:
2020-04-19T23:32:38.600+0200, TRACE, elt.log.examples.LoggingBasicExampleCustomConfig/main, First elt.log.test logger message
2020-04-19T23:32:38.600+0200, ERROR, elt.log.examples.LoggingBasicExampleCustomConfig/main, Second elt.log.test logger message
And the following output on the the custom-example.log file in the logsink directory:
Cref=LoggingBasicExampleCustomConfig.java-38, Date=2020-04-19T23:32:38.597+0200, HostName=docker-eso-eelt, LogType=INFO, SourceID=elt.log.examples.LoggingBasicExampleCustomConfig/main, LogID=.main-38, Message=First root logger message
Cref=LoggingBasicExampleCustomConfig.java-58, Date=2020-04-19T23:32:38.600+0200, HostName=docker-eso-eelt, LogType=TRACE, SourceID=elt.log.examples.LoggingBasicExampleCustomConfig/main, LogID=elt.log.test.main-58, Message=First elt.log.test logger message
Cref=LoggingBasicExampleCustomConfig.java-66, Date=2020-04-19T23:32:38.600+0200, HostName=docker-eso-eelt, LogType=ERROR, SourceID=elt.log.examples.LoggingBasicExampleCustomConfig/main, LogID=elt.log.test.main-66, Message=Second elt.log.test logger message
9.4.6.2. C++
This example shown in Listing 4‑9 can be run with the $CIISRV_ROOT/bin/logging-example-customconfig-app executable file installed by the logging-examples module.
Listing 4‑9 C++ example app with custom configuration
int main(int ac, char *av[]) {
  try {
    /*
     * Logging is initialized with custom configuration.
     *
     * This custom configuration has two loggers:
     *     - root: With a INFO level and a rolling file appender to
     *             $CIISRV_ROOT/logsink directory
     *     - "elt.log.test": With a TRACE level, a console appender, and
     *                       additivity enabled
     */
    ::elt::log::CiiLogManager::Configure("log4cplus-test.prop");

    /* Get the root logger.*/
    log4cplus::Logger root_logger = ::elt::log::CiiLogManager::GetLogger();

    /* Send INFO level message to root logger
     * This log will be output to the log file in logsink directory
     */
    root_logger.log(log4cplus::INFO_LOG_LEVEL, "First root logger message");

    /* Send TRACE level message to root logger. This log message will be
     * discarded due to the root logger having a threshold level of INFO
     */
    root_logger.log(log4cplus::TRACE_LOG_LEVEL, "Second root logger message");

    /* Get a logger with name 'elt.log.test' */
    log4cplus::Logger logger = ::elt::log::CiiLogManager::GetLogger("elt.log.test");

    /*
     * Send TRACE level message to elt.log.test logger
     * This log will be outputed to console since the minimum log level is
     * TRACE.
     * It will be also passed to its parent logger (root) since additivity
     * property of this logger is set to true. The root logger will accept it
     * also, despite of its level being set to INFO. This is due to the fact
     * that the logger level threshold is only checked at the logger where the
     * message is created.
     * If a threshold level would be set to on the appender attached to the
     * root logger, that one would be applied.
     */
    logger.log(log4cplus::TRACE_LOG_LEVEL,
               "First elt.log.test logger message");

    /*
     * Send ERROR level message to elt.log.test logger
     * This log will be output to console since the minimum log level is
     * TRACE.
     * It will be also passed to its parent logger (root) since additivity
     * property of this logger is set to true. The root logger will also pass
     * it to the logsink file appender.
     */
    logger.log(log4cplus::ERROR_LOG_LEVEL,
               "Second elt.log.test logger message");

    return 0;
  } catch (const ::elt::error::CiiException& ex) {
    std::cerr << "CiiException occured while executing sample code. What: "
      << ex.what() << '\n';
  }
  return -1;
Listing 4‑10 Log4cplus custom configuration
log4cplus.rootLogger=INFO, ROLLINGFILE
log4cplus.logger.elt.log.test=TRACE, STDOUT
log4cplus.additivity.elt.log.test=TRUE
log4cplus.appender.STDOUT=log4cplus::ConsoleAppender
log4cplus.appender.STDOUT.layout=elt::log::layout::CiiSimpleLayout
log4cplus.appender.ROLLINGFILE=log4cplus::RollingFileAppender
log4cplus.appender.ROLLINGFILE.File=/home/rfernandez/INTROOT/logsink/custom-example.log
log4cplus.appender.ROLLINGFILE.MaxFileSize=16MB
log4cplus.appender.ROLLINGFILE.MaxBackupIndex=1
log4cplus.appender.ROLLINGFILE.layout=elt::log::layout::CiiLayout
This configuration would produce the following output on console:
2020-04-19T23:32:38.600+0200, TRACE, elt.log.test/139781441696448, First elt.log.test logger message
2020-04-19T23:32:38.600+0200, ERROR, elt.log.test/139781441696448, Second elt.log.test logger message
And the following output on the the custom-example.log file in the logsink directory:
Cref=../cpp/logging-customconfig-app/src/logging-customconfig-app.cpp-105, Date=2020-04-19T23:32:38.597+0200, HostName=docker-eso-eelt, LogType=INFO, SourceID=139781441696448, LogID=root.main-105, Message=First root logger message
Cref=../cpp/logging-customconfig-app/src/logging-customconfig-app.cpp-125, Date=2020-04-19T23:32:38.600+0200, HostName=docker-eso-eelt, LogType=TRACE, SourceID=139781441696448, LogID=elt.log.test.main-125, Message=First elt.log.test logger message
Cref=../cpp/logging-customconfig-app/src/logging-customconfig-app.cpp-134, Date=2020-04-19T23:32:38.600+0200, HostName=docker-eso-eelt, LogType=ERROR, SourceID=139781441696448, LogID=elt.log.test.main-134, Message=Second elt.log.test logger message
9.4.6.3. Python
This example shown in Listing 4‑11 can be run with the $CIISRV_ROOT/bin/cii-logging-example-customconfig-app-py executable file installed by the logging-examples module.
Listing 4‑11 Python example app with custom configuration
def main():
    """
    Main application code
    @return status code, int
    """
    result = 0
    try:
        # Logging is initialize with custom configuration
        #
        # This custom configuration has two loggers:
        #   - root: With a INFO level and rolling file handler to
        #           $CIISRV_ROOT/logsink directory
        #   - "elt.log.test": With a TRACE level, a console appender and
        #                     propagation enabled
        CiiLogManager.configure(CONFIG_FILE_NAME)

        # Get the root logger
        root_logger = CiiLogManager.get_logger()

        # Send INFO level message to root logger
        # This log will be forwarded to the lof file in logsink directory
        root_logger.info("First root logger message")

        # Send TRACE level message to root logger.
        # This log message will be discarded due to the
        # root logger having ad threshold level of INFO
        root_logger.trace("Second root logger message")

        # Get a logger with name 'elt.log.test'
        logger = CiiLogManager.get_logger("elt.log.test")

        # Send a TRACE level message to elt.log.test logger
        # This log will be forwarded to console since the minimum log level is
        # TRACE.
        # It will be also passed to its parent logger (root) since propagate
        # property of this logger is set to True (by default). The root logger
        # will also pass it to the logsink file handler. This is due to the
        # fact that the logger level threshold is only checked at the logger
        # where the message is created.
        logger.trace("First elt.log.test logger message")

        # Send ERROR level message to elt.log.test logger
        # This log will be displayed on console since the minimum log level is
        # TRACE.
        # It will be also passed to its parent logger (root) since propagate
        # property of this logger is set to True (by default). The root logger
        # will also pass it to the logsing file handler.
        logger.error("Second elt.log.test logger message")
    except Exception as e:
        print('Exception occured while executing sample code: %s', e)
        result = 5
    return result
if __name__ == '__main__':
    sys.exit(main())
Listing 4‑12 Python logging custom configuration
{
    "version": 1,
    "handlers": {
        "logsink": {
            "class": "logging.handlers.RotatingFileHandler",
            "backupCount": 5,
            "filename": "CII_LOGSINK_FILENAME",
            "formatter": "cii",
            "maxBytes": 10485760
        },
        "console": {
            "class": "logging.StreamHandler",
            "formatter": "cii-brief",
            "stream": "ext://sys.stdout"
        }
    },
    "root": {
        "handlers": [
            "logsink"
        ],
        "level": "INFO"
    },
    "loggers": {
        "elt.log.test": {
          "handlers": [
              "console"
          ],
          "level": "TRACE"
        }
    }
}
This configuration would produce the following output on console:
2020-04-19T23:32:38.600+0200, TRACE, cii-logging-example-customconfig-app-py/MainThread, First elt.log.test logger message
2020-04-19T23:32:38.600+0200, ERROR, cii-logging-example-customconfig-app-py/MainThread, Second elt.log.test logger message
And the following output on the eelt-dev-output.log file in the logsink directory:
Cref= cii-logging-example-customconfig-app-py.main-92, Date=2020-04-19T23:32:38.597+0200, HostName=docker-eso-eelt, LogType=INFO, SourceID= cii-logging-example-customconfig-app-py/MainThread, LogID=main-92, Message=First root logger message
Cref= cii-logging-example-customconfig-app-py.main-108, Date=2020-04-19T23:32:38.600+0200, HostName=docker-eso-eelt, LogType=TRACE, SourceID= cii-logging-example-customconfig-app-py/MainThread, LogID=main-108, Message=First elt.log.test logger message
Cref= cii-logging-example-customconfig-app-py.main-115, Date=2020-04-19T23:32:38.600+0200, HostName=docker-eso-eelt, LogType=ERROR, SourceID= cii-logging-example-customconfig-app-py/MainThread, LogID=main-115, Message=Second elt.log.test logger message
9.4.7. Adding optional information to log messages
Some of the fields in a CII log message are optional and have to be explicitly added to a log event by the user. As explained in section 4.2, the CII Log Client API, through the CiiLogMessageBuilder, provides a mechanism to create log messages with this additional information using a builder pattern.
This optional information can be added to a log message:
Audience: The intended audience of the log message
UserLogID: A log ID provided by the user.
Formatted CiiException: A CII Exception [3] provided by the user that will be formatted into the fields:
ErrorMessage
ErrorTypeName
ErrorDateTime
ErrorTrace
Tracing info: The builder is responsible for extracting the following data from an existing active Tracing context:
TraceID
SpanID
Once the optional parameters are defined, the user can call the build() method on the builder to produce the formatted string with the selected optional fields.
The builder also provides convenience factory methods for the most common logging use cases: setting a log’s audience and logging a formatted CII Error.
Support for tracing information is currently not available for C++ and Python. It will be added in following releases.
Complete API can be found in Appendix A.
Sections 4.7.1, 4.7.2, 4.7.3 show usage examples for the CiiLogMessageBuilder on Java, C++, and Python. All examples follow the same workflow.
First, the language-specific logging frameworks are initialized with the default CII configuration and a logger named myLogger is retrieved.
(How to enable tracing to be added in following versions)
Then, the following logs with optional information are produced:
A log with a message, a custom user ID, and an audience value.
A log with a message and a formatted CII exception using the builder pattern.
A log with a message and a formatted CII exception using the builder’s convenience method.
A log with a message and an audience value using the builder’s convenience method.
A log without message and a formatted CiiException. Since no message is passed, the CiiException error message will be used as log message field.
A log with current tracing context information. Note that these examples will not output any tracing information, since tracing is not enabled. These examples are meant to illustrate the usage of the CiiLogMessageBuilder.
9.4.7.1. Java
The example shown in Listing 4‑13 can be run from the root directory of the logging-examples module with the run-logging-example-message-builder-java provided script.
Listing 4‑13 Adding optional info to logs (Java)
package elt.log.examples;

import elt.error.CiiException;
import elt.error.CiiInvalidTypeException;
import elt.log.CiiLogAudience;
import elt.log.CiiLogMessageBuilder;
import org.apache.logging.log4j.Logger;
import elt.log.CiiLogManager;

public class LoggingMessageBuilderExample {

    public static void main(String[] args) {

        //initialize Log4j with default CII configuration and retieve
        //"myLogger" Logger
        Logger logger = CiiLogManager.getLogger("myLogger");

        //Build and log message with message value, user ID and DEVELOPER
        //audience
        logger.error(CiiLogMessageBuilder.create("Message value")
                            .withUserLogId("user_log_id")
                            .withAudience(CiiLogAudience.DEVELOPER)
                            .build());

        CiiException e =
                    new CiiInvalidTypeException("Exception error message");

        //Build and log message with formatted CiiException using builder
        //pattern
        logger.error(CiiLogMessageBuilder.create()
                            .withMessage("This is and exception")
                            .withCiiException(e)
                            .build());

        //Build and log message with formatted CiiException using the
        //convenience method
        logger.error(CiiLogMessageBuilder.createAndBuildWithException(
                "This is an exception", e));

        //Build and log message with DEVELOPER audience
        logger.error(CiiLogMessageBuilder.createAndBuildWithAudience(
                "Message for DEVELOPER audience", CiiLogAudience.DEVELOPER));

        //Build and log message with formatted CiiException using the
        //convenience method without passing a message field value
        logger.error(
                CiiLogMessageBuilder.createAndBuildWithException(null, e));

        //Build and log a message with tracing context information
        logger.error(CiiLogMessageBuilder.create(
                "This is a log message with tracing info")
                            .withTracingInfo()
                            .build());
    }
}
The log output from this code, using the CiiSimpleLayout, would be the following:
Listing 4‑14 Output CiiLogMessageBuilder usage example Java
2020-03-30T10:05:46.377+0200, ERROR, elt.log.examples.LoggingMessageBuilderExample/main, Message value, Audience=DEVELOPER, UserLogID=user_log_id

2020-03-30T10:05:46.401+0200, ERROR, elt.log.examples.LoggingMessageBuilderExample/main, This is and exception, ErrorTypeName=elt.error.CiiInvalidTypeException, ErrorDateTime=1585523146401, ErrorMessage=Invalid type detected Exception error message, ErrorTrace=elt.error.CiiInvalidTypeException
     at elt.log.examples.LoggingMessageBuilderExample.main(LoggingMessageBuilderExample.java:23)

2020-03-30T10:05:46.402+0200, ERROR, elt.log.examples.LoggingMessageBuilderExample/main, This is an exception, ErrorTypeName=elt.error.CiiInvalidTypeException, ErrorDateTime=1585523146401, ErrorMessage=Invalid type detected Exception error message, ErrorTrace=elt.error.CiiInvalidTypeException
     at elt.log.examples.LoggingMessageBuilderExample.main(LoggingMessageBuilderExample.java:23)

2020-03-30T10:05:46.402+0200, ERROR, elt.log.examples.LoggingMessageBuilderExample/main, Message for DEVELOPER audience, Audience=DEVELOPER

2020-03-30T10:05:46.402+0200, ERROR, elt.log.examples.LoggingMessageBuilderExample/main, Invalid type detected Exception error message, ErrorTypeName=elt.error.CiiInvalidTypeException, ErrorDateTime=1585523146401, ErrorMessage=Invalid type detected Exception error message, ErrorTrace=elt.error.CiiInvalidTypeException
     at elt.log.examples.LoggingMessageBuilderExample.main(LoggingMessageBuilderExample.java:23)

2020-03-30T10:05:46.403+0200, ERROR, elt.log.examples.LoggingMessageBuilderExample/main, This is a log message with tracing info
9.4.7.2. C++
This example can be run with the $CIISRV_ROOT/bin/logging-example-messagebuilder executable file installed by the logging-examples module.
Listing 4‑15 Adding optional info to logs (C++)
int main(int ac, char *av[]) {
  try {
    log4cplus::Logger logger = ::elt::log::CiiLogManager::GetLogger("myLogger");

    //Build and log message with message value, user ID and DEVELOPER audience
    logger.log(log4cplus::ERROR_LOG_LEVEL,
      ::elt::log::CiiLogMessageBuilder::Create().WithMessage("Message value")
        .WithUserLogId("user_log_id")
        .WithAudience(::elt::log::CiiLogAudience::DEVELOPER)
        .Build());

    try {
      CII_THROW(::elt::error::CiiException, "TEST EXCEPTION");
    } catch (const elt::error::CiiException& e) {
      //Build and log message with formatted CiiException using builder
      //pattern
      logger.log(log4cplus::ERROR_LOG_LEVEL,
        ::elt::log::CiiLogMessageBuilder::Create()
       .WithMessage("This is and exception")
          .WithException(e)
          .Build());

      //Build and log message with formatted CiiException using the
      //convenience method
      logger.log(log4cplus::ERROR_LOG_LEVEL,
        ::elt::log::CiiLogMessageBuilder::CreateAndBuildWithException(
                         "This is an exception", e));
    }

    //Build and log message with DEVELOPER audience
    logger.log(log4cplus::ERROR_LOG_LEVEL,
      ::elt::log::CiiLogMessageBuilder::CreateAndBuildWithAudience(
        "Message for DEVELOPER audience",
         ::elt::log::CiiLogAudience::DEVELOPER));

    //Build and log a message with tracing context information
    logger.log(log4cplus::ERROR_LOG_LEVEL,
      ::elt::log::CiiLogMessageBuilder::Create(
           "This is a log message with tracing info")
         .WithTracingInfo(true).Build());

    return 0;
  } catch (const ::elt::error::CiiException& ex) {
    std::cerr << "CiiException occured while executing sample code. What: "
      << ex.what() << '\n';
  }
  return -1;
}
The output of the code in Listing 4‑15 using the CiiSimpleLayout would be the following:
Listing 4‑16 Output CiiLogMessageBuilder usage example C++
2020-04-19T21:56:56.130+0200, ERROR, myLogger/140218499314368, Message value, Audience=DEVELOPER, UserLogID=user_log_id
2020-04-19T21:56:56.303, ERROR, myLogger/140218499314368, This is and exception, ErrorTypeName=elt::error::CiiException, ErrorDateTime=1587333416, ErrorMessage=TEST EXCEPTION, ErrorTrace= 0# elt::error::CiiException::CiiException(std::string const&) at ../elt-common/cpp/error/client/src/ciiException.cpp:29
 1# main at ../cpp/logging-messagebuilder-app/src/logging-messagebuilder-app.cpp:25
 2# __libc_start_main in /lib64/libc.so.6
 3# 0x0000000000414039 in cii-logging-example-messagebuilder-app

2020-04-19T21:56:56.303+0200, ERROR, myLogger/140218499314368, This is an exception, ErrorTypeName=elt::error::CiiException, ErrorDateTime=1587333416, ErrorMessage=TEST EXCEPTION, ErrorTrace= 0# elt::error::CiiException::CiiException(std::string const&) at ../elt-common/cpp/error/client/src/ciiException.cpp:29
 1# main at ../cpp/logging-messagebuilder-app/src/logging-messagebuilder-app.cpp:25
 2# __libc_start_main in /lib64/libc.so.6
 3# 0x0000000000414039 in cii-logging-example-messagebuilder-app

2020-04-19T21:56:56.303+0200, ERROR, myLogger/140218499314368, Message for DEVELOPER audience, Audience=DEVELOPER
2020-04-19 21:56:56.303, ERROR, myLogger/140218499314368, This is a log message with tracing info
9.4.7.3. Python
This example can be run with the $CIISRV_ROOT/bin/cii-logging-example-messagebuilder-py executable file installed by the logging-examples module.
Listing 4‑17 Adding optional info to logs (Python)
def main():
    """
    Main application code
    @return status code, int
    """
    result = 0
    try:
        logger = CiiLogManager.get_logger("myLogger")

        # Build and log message with message value, user ID and DEVELOPER
        # audience
        logger.error(CiiLogMessageBuilder()
                     .with_message("Message value")
                     .with_user_log_id("user_log_id")
                     .with_audience(CiiLogAudience.DEVELOPER)
                     .build())
        try:
            raise CiiException("TEST EXCEPTION")
        except CiiException as e:
            # Build and log message with formatted exception using builder
            # pattern
            logger.error(CiiLogMessageBuilder.create()
                         .with_message("This is an exception")
                         .with_exception(e)
                         .build())
            # Build and log message with formatted exception using convenience
            # method
            logger.error(CiiLogMessageBuilder
                  .create_and_build_with_exception("This is an excaption", e))
        # Build and log message with DEVELOPER audience
        logger.error(CiiLogMessageBuilder
                     .create_and_build_with_audience("Message for DEVELOPER audience", CiiLogAudience.DEVELOPER))
        # Build and log a message with tracing context information
        logger.error(CiiLogMessageBuilder
                     .create("This is a log message with tracing info")
                     .with_tracing_info(True)
                     .build())
        # Build and log a message with keyword args
        logger.error(CiiLogMessageBuilder
                     .create_and_build_with_args(message='This is a message',
                                           user_log_id='USER_LOG_ID',
                                           audience=CiiLogAudience.DEVELOPER))
    except Exception as e:
        print('Exception occured while executing sample code: %s', e)
        result = 5
    return result

if __name__ == '__main__':
    sys.exit(main())
The output of the code in Listing 4‑17 using the CiiSimpleLayout would be the following:
Listing 4‑18 Output CiiLogMessageBuilder usage example Python
2020-04-19T21:56:56.130+0200, ERROR, cii-logging-example-messagebuilder-app-py/MainThread, Message value, Audience=DEVELOPER, UserLogID=user_log_id
2020-04-19T21:56:56.303+0200, ERROR, cii-logging-example-messagebuilder-app-py/MainThread, This is an exception, ErrorTypeName=elt.error.Exceptions.CiiException, ErrorDateTime=1588727172250, ErrorMessage=TEST EXCEPTION, ErrorTrace=Traceback (most recent call last):
  File "/home/rfernandez/INTROOT/bin/cii-logging-example-messagebuilder-app-py", line 30, in main
    raise CiiException("TEST EXCEPTION")
elt.error.Exceptions.CiiException: TEST EXCEPTION

2020-04-19T21:56:56.303+0200, cii-logging-example-messagebuilder-app-py/MainThread, This is an excaption, ErrorTypeName=elt.error.Exceptions.CiiException, ErrorDateTime=1588727172250, ErrorMessage=TEST EXCEPTION, ErrorTrace=Traceback (most recent call last):
  File "/home/rfernandez/INTROOT/bin/cii-logging-example-messagebuilder-app-py", line 30, in main
    raise CiiException("TEST EXCEPTION")
elt.error.Exceptions.CiiException: TEST EXCEPTION

2020-04-19T21:56:56.303+0200, ERROR, cii-logging-example-messagebuilder-app-py/MainThread, Message for DEVELOPER audience, Audience=DEVELOPER
2020-04-19T21:56:56.303+0200, ERROR, cii-logging-example-messagebuilder-app-py/MainThread, This is a log message with tracing info
2020-04-19T21:56:56.303+0200, ERROR, cii-logging-example-messagebuilder-app-py/MainThread, This is a message, Audience=DEVELOPER, UserLogID=USER_LOG_ID
9.4.8. String formatting
Usage of formatted strings in the printf style is supported in both Java, C++, and Python.
In Java, the String.format method can be used to construct the required message. Also, the Logger instances returned by CiiLogManager.getlogger support string formatting.
The following examples would produce a log with the message “Number: 100”.
logger.debug(String.format("Number: %d", 100));
logger.debug("Number: %d", 100);
In C++ it is supported through the LOG4CPLUS_<LEVEL>_FMT macros [20], as shown in the following example:
LOG4CPLUS_WARN_FMT(root, "Number: %d", 100);
In Python it is also supported using the language’s regular string formatting constructs.
logger.error("Number: %d", 100)
logger.error("Number: %d" % 100)
9.4.8.1. Compile-time validation
Compile-time validation of the formatted strings is supported for Java and for C++.
In the C++ case, compile time validation is automatically done if the LOG4CPLUS_<LEVEL>_FMT macros [20] are used.
In Java, this is supported through the Checker Framework [17]. This solution doesn’t only apply to formatted Strings used in log messages, but to any formatted string in the source code.
The Format String Checker prevents the use of incorrect format strings in format methods such as System.out.printf, String.format, or the Logger log methods. It warns the developer if an invalid format string is written, and it warns if the other arguments are not consistent with the format string (in number of arguments or in their types).
Checker Framework library is installed in the system as part of srv-support-libs when client-apis module is installed. Once installed it can be used during compilation as shown in the example below that compiles class TestUnitLogStringCheckerTest.java:
export CHECKERFRAMEWORK=$CIISRV_ROOT/lib/srv-support-libs/checker-framework-3.2

javac -J-Xbootclasspath/p:$CHECKERFRAMEWORK/javac.jar \
-Xbootclasspath/p:$CHECKERFRAMEWORK/jdk8.jar \
-cp $CHECKERFRAMEWORK/checker-qual.jar:$CIISRV_ROOT/lib/srv-support-libs/*:$CIISRV_ROOT/lib/ \
-processorpath $CHECKERFRAMEWORK/checker.jar \
-processor org.checkerframework.checker.formatter.FormatterChecker \
-Astubs=$CHECKERFRAMEWORK/Logger.astub \
 -source 8 -target 8 TestUnitLogStringCheckerTest.java
In Python this is not supported, since it is not compiled.
9.4.9. Using the Postmortem Buffer
This section describes the usage of the postmortem buffer. By default, this buffer is disabled and it is the responsibility of the user to enable it.
The postmortem buffer is configured through two environment variables:
CII_LOG_BUFFER_ON: If set to true, the postmortem buffer will enabled. If not set, or set to any other value, the postmortem buffer will be disabled.
CII_LOG_BUFFER_TTL_MS: Time-To-Live in milliseconds of the buffered log events.
Changes to these environment variables, once the logging has been initialized, will not have any effect on the current configuration. In order for it to be applied, logging must be shut down and initialized again.
Programatic and file-based configurations of the postmortem buffer will take precedence over these environment variables.
Due to the differences in implementations and APIs of the logging frameworks CII Log Client API leverages on, the implementation and usage of the postmortem buffer vary from language to language. Configuration and usage instructions are described for each of the three languages in the following subsections.
Note: Enabling the postmortem buffer can make significant performance impact. The impact depends on the number of produced logs. When it is, enabled, all the logging events (regardless of its level) will gather all the log context information (hostname, line number, file name, etc…). Gathering this information will take significant time, when a lot of logs are produced.
9.4.9.1. Java
In addition to the configuration of the postmortem buffer through environment variables, it is possible to configure it using system properties.
cii.log.buffer.on: This property defines if the buffer is enabled or not. By default, it is disabled. Must be set to true to enable the buffer.
cii.log.buffer.ttl.ms: This property defines the TTL value in milliseconds for entries in the buffer. Default is 60000 ms (1 min).
These properties must be set before initialization of the Log4j framework in order for them to have effect.
If any of these system properties are defined, it will override the environment variable for that configuration parameter.
Once the logging framework is initialized, it is not possible to enable or disable the postmortem buffer.
If the postmortem buffer is enabled, once the configuration is initialized it is not possible to perform any changes to the active configuration using the Log4j API. The Logger.getLevel() method or any method to retrieve levels or filters configuration at runtime can return an incorrect value and should not be relied upon.
The example in Listing 4‑19 describes a standard workflow using the postmortem buffer.
In the first place, the cii.log.buffer.on property is set in order to enable the postmortem buffer. Also, the cii.log.buffer.ttl.ms property is set to a custom value of 30 seconds, setting the events TTL in the buffer to that value.
Then, a logger object is obtained with the name of the current class. Since no custom configuration has been defined, it will automatically initialize the logging framework to the default CII configuration. Default configuration only has the root logger configured; therefore, the retrieved object will use the root logger configuration, which filters out logs from levels below ERROR.
After, a log message is produced for every log level, from TRACE to FATAL. Only logs of levels ERROR and FATAL will be logged by the appenders.
Finally, the CiiLogManager.flushBufferedAppender() method is called. This will output all the buffered logs to all appenders that originally rejected them, whether it was filtered out by the logger or by the appender itself. Listing 4‑20 shows the console output of the execution of the example. As can be seen, first, the ERROR and FATAL messages are printed to console, and then, when the postmortem buffer is flushed, the rest of the log messages are printed to the console.
The example shown in Listing 4‑19 can be run from the root directory of the logging-examples module with the run-logging-example-postmortem-buffer-java provided script.
Listing 4‑19 Example postmortem appender (Java)
package elt.log.examples;

import elt.log.CiiLogManager;
import org.apache.logging.log4j.Level;
import org.apache.logging.log4j.Logger;


public class PostmortemAppenderExample {

    public static void main(String[] args) {

        // Enable the postmortem appender
        // This must be done before initializing Log4j
        System.setProperty("cii.log.buffer.on", "true");
        // Set the time-to-live of the log events in the buffer to 30s
        System.setProperty("cii.log.buffer.ttl.ms", "30000");

        // Automatically initialize the logging framework with console and
        // file appender and get the logger with the name
        // elt.log.examples.PostmortemAppenderExample
        Logger logger = CiiLogManager.getLogger(
                PostmortemAppenderExample.class.getCanonicalName());

        // Create a log message of each level. Only messages of levels ERROR
        // and FATAL will be output to the console and file
        logger.log(Level.TRACE, "Trace message");
        logger.log(Level.DEBUG, "Debug message");
        logger.log(Level.INFO, "Info message");
        logger.log(Level.WARN, "Warn message");
        logger.log(Level.ERROR, "Error message");
        logger.log(Level.FATAL, "Fatal message");

        try {
            Thread.sleep(500);
        } catch (InterruptedException e) {
            e.printStackTrace();
        }

        // Flush the postmortem appender. Logs of levels TRACE, DEBUG, INFO,
        // and WARN will be now output to the console and file
        CiiLogManager.flushPostmortemBuffer();
    }
}
This example produces the following output:
Listing 4‑20 Console output from postmortem example (Java)
2020-03-12T22:33:14.524+0100, ERROR, elt.log.examples.PostmortemAppenderExample/main, Error message
2020-03-12T22:33:14.524+0100, FATAL, elt.log.examples.PostmortemAppenderExample/main, Fatal message
2020-03-12T22:33:14.524+0100, TRACE, elt.log.examples.PostmortemAppenderExample/main, Trace message
2020-03-12T22:33:14.524+0100, DEBUG, elt.log.examples.PostmortemAppenderExample/main, Debug message
2020-03-12T22:33:14.524+0100, INFO, elt.log.examples.PostmortemAppenderExample/main, Info message
2020-03-12T22:33:14.524+0100, WARN, elt.log.examples.PostmortemAppenderExample/main, Warn message
9.4.9.1.1. Async Logging
Log4j supports asynchronous logging, as described in [11]. It’s important to note that when using custom configurations, the includeLocation property of loggers’ configuration must be explicitly set to true. Otherwise, information as the source code file and line references will be lost. It is also necessary for the postmortem buffer to work as intended since it relies on a log event’s context data, which would otherwise be lost.
This also needs to be taken into consideration when flushing the buffer, since it’s possible that some of the last produced log events might have not been processed yet by the buffer at the time of flushing when asynchronous logging is used.
9.4.9.2. C++
In C++, the postmortem buffer can be configured using the environment variables mentioned earlier, as well as programmatically. The CiiLogConfigurator class provides methods to initialize a configuration with the postmortem buffer enabled, as well as a method to enable the postmortem buffer once the configuration has been already initialized.
When the postmortem buffered is flushed, log messages indicating the START and END of the flushed logs will be injected, as can be seen in Listing 4‑22, helping the user identify the logs that were buffered by the postmortem facility.
More details on how to configure the postmortem buffer can be found in Appendix A.2.
A usage example of the postmortem buffer in C++ is shown in Listing 4‑21. In this example, the postmortem buffer is enabled and a log TTL of 30 seconds is set. Then, logging is initialized with the default configuration. A series of log messages of different levels are produced, and finally, the postmortem buffer is flushed to all the configured appenders.
This example can be run with the $CIISRV_ROOT/bin/logging-example-postmortem-buffer-app executable file installed by the logging-examples module.
Listing 4‑21 Example postmortem appender (C++)
int main(int ac, char *av[]) {
  try {
    //Enable postmortem appender and set the time-to-live of the log events in
    //the buffer to 30s
    std::string postmortem_enable_env = std::string(
      ::elt::log::CiiLogManager::POSTMORTEM_APPENDER_ENABLED_ENV_VAR) +
      "=true";
    putenv(const_cast<char*>(postmortem_enable_env.c_str()));

    std::string postmortem_ttl_env = std::string(
      ::elt::log::CiiLogManager::POSTMORTEM_APPENDER_ENTRYTTL_MS_ENV_VAR) +
      "=30000";
    putenv(const_cast<char*>(postmortem_ttl_env.c_str()));

    // Automatically initialize the logging framework with console and file
    // appender and get the logger with the name
    // elt.log.examples.PostmortemAppenderExample
    log4cplus::Logger logger = ::elt::log::CiiLogManager::GetLogger(
      "PostmortemAppenderExample");

    // Create a log message of each level
    // Only messages of levels ERROR and FATAL will be output to the console
    // and file
    logger.log(log4cplus::TRACE_LOG_LEVEL, "Trace message");
    logger.log(log4cplus::DEBUG_LOG_LEVEL, "Debug message");
    logger.log(log4cplus::INFO_LOG_LEVEL, "Info message");
    logger.log(log4cplus::WARN_LOG_LEVEL, "Warn message");
    logger.log(log4cplus::ERROR_LOG_LEVEL, "Error message");
    logger.log(log4cplus::FATAL_LOG_LEVEL, "Fatal message");
    std::this_thread::sleep_for(std::chrono::seconds(1));

    // Flush the postmortem appender.
    // Logs of levels TRACE, DEBUG, INFO, and WARN will be now output to the
    // console and file
    ::elt::log::CiiLogManager::FlushPostmortemBuffer();

    return 0;
  } catch (const ::elt::error::CiiException& ex) {
    std::cerr << "CiiException occured while executing sample code. What: "
      << ex.what() << '\n';
  }
  return -1;
}
This example produces the following output:
Listing 4‑22 Console output from postmortem example (C++)
2020-04-19T22:27:50.415+0100, ERROR, PostmortemAppenderExample/140577659003584, Error message
2020-04-19T22:27:50.415+0100, FATAL, PostmortemAppenderExample/140577659003584, Fatal message
2020-04-19T22:27:51.416+0100, TRACE, root/140577659003584, [START] DUMPING POSTMORTEM LOGS
2020-04-19T22:27:50.415+0100, TRACE, PostmortemAppenderExample/140577659003584, Trace message
2020-04-19T22:27:50.415+0100, DEBUG, PostmortemAppenderExample/140577659003584, Debug message
2020-04-19T22:27:50.415+0100, INFO, PostmortemAppenderExample/140577659003584, Info message
2020-04-19T22:27:50.415+0100, WARN, PostmortemAppenderExample/140577659003584, Warn message
2020-04-19T22:27:51.416+0100, TRACE, root/140577659003584, [END] DUMPING POSTMORTEM LOGS
9.4.9.3. Python
The postmortem buffer can be configured by one of the methods provided by the elt.log.CiiLogManager module. Note that once the buffered logger is configured into the system, it can not be disabled.
The standard Python Logging API is unaffected by the use of the postmortem buffer.
The example in Listing 4‑23 shows an example usage of the postmortem buffer in Python.
More details on how to configure the postmortem buffer can be found in Appendix A.3.
An usage example of the postmortem buffer in Python is shown in Listing 4‑23. In this example, the postmortem buffer is enabled and a log TTL of 30 seconds is set. Then, logging is initialized with the default configuration. A series of log messages of different level are produced, and finally the postmortem buffer is flushed to all the configured handlers.
This example can be run with the $CIISRV_ROOT/bin/cii-logging-example-postmortem-buffer-app-py executable file installed by the logging-examples module.
Listing 4‑23 Example postmortem buffer (Python)
def main():
    """
    Main application code
    @return status code, int
    """
    result = 0
    try:
        # Enable postmortem functionality and set time-to-live of the log events
        # in the buffer to 30s
        os.environ[CiiLogManager.POSTMORTEM_BUFFER_ON_ENV_VAR] = 'true'
        os.environ[CiiLogManager.POSTMORTEM_BUFFER_TTL_MS_ENV_VAR] = '30000'

        # Automatically initialize the logging framework with console and file
        # handler and get the logger with name 'PostmortemBufferExample'
        logger = CiiLogManager.get_logger("PostmortemBufferExample")

        # Create a log message of each level
        # Only messages of levels ERROR and FATAL will be outoput to the console
        # and file

        logger.trace("Trace message")
        logger.debug("Debug message")
        logger.info("Info message")
        logger.warning("Warning message")
        logger.error("Error message")
        logger.fatal("Fatal message")

        # Wait a little
        time.sleep(1)

        print('Flushing postmortem buffer')
        # Flush postmortem buffer, trace, debug and info messages should be seen
        # on stdout
        CiiLogManager.flush_postmortem_buffer()

    except Exception as e:
        print('Exception occured while executing sample code: %s', e)
        result = 5
    return result

if __name__ == '__main__':
    sys.exit(main())
This example produces the following output:
2020-05-06T11:45:02.407+0100, ERROR, cii-logging-example-postmortem-buffer-app-py/MainThread, Error message
2020-05-06T11:45:02.407+0100, CRITICAL, cii-logging-example-postmortem-buffer-app-py/MainThread, Fatal message
2020-05-06T11:45:02.407+0100, TRACE, cii-logging-example-postmortem-buffer-app-py/MainThread, Trace message
2020-05-06T11:45:02.407+0100, DEBUG, cii-logging-example-postmortem-buffer-app-py/MainThread, Debug message
2020-05-06T11:45:02.407+0100, INFO, cii-logging-example-postmortem-buffer-app-py/MainThread, Info message
2020-05-06T11:45:02.407+0100, WARNING, cii-logging-example-postmortem-buffer-app-py/MainThread, Warning message
9.5. Logging services configuration
These sections describe how to configure the Filebeat and Logstash services according to the CII log transmission & management use cases.
It is necessary to deploy a Filebeat instance on each host that produces logs that need to be persisted to Elasticsearch. Said instance can handle logs produced by any number of applications running on the host if appropriate configuration is provided.
A single instance of Logstash is necessary, which can be running on the same host or on a remote host. Multiple Logstash instances can be deployed, if needed, in different hosts for performance, infrastructure management, or any other reason. This allows for scalability of the transmission and management subsystem.
9.5.1. Filebeat
The Filebeat service needs to be configured to harvest logs from the logsink directory and then send those to a Logstash instance. An introduction to Filebeat configuration and a basic example configuration for the CII Log system, are described below.
9.5.1.1. Basic configuration example
In order to create a Filebeat configuration, it is necessary to define inputs and outputs. The inputs describe which files are harvested for logs and how, and the outputs describe where these harvested log events are sent. In Listing 6‑1 an example serialized log event is shown. The CII Log message string is not parsed at this stage, and its raw value is stored in the message field of the JSON object output by Filebeat.
Listing 6‑1 Example Filebeat log event output
{
  "@timestamp": "2020-01-17T10:57:07.656Z",
  "@metadata": {
    "beat": "filebeat",
    "type": "doc",
    "version": "6.8.6"
  },
  "offset": 0,
  "log": {
    "file": {
      "path": "/home/eelt-dev/INTROOT/logsink/test_logs_1.log "
    }
  },
  "prospector": {
    "type": "log"
  },
  "input": {
    "type": "log"
  },
  "beat": {
    "name": "docker-eso-eelt",
    "hostname": "docker-eso-eelt",
    "version": "6.8.6"
  },
  "host": {
    "name": "docker-eso-eelt"
  },
  "message": "Cref=LogProducer.java-16, Date=2020-01-28T17:51:12.906+0100, HostName=docker-eso-eelt, LogType=TRACE, SourceID=elt.log.testing.LogProducer/main, LogID=elt.log.testing.LogProducer.main-16, Message=Test TRACE log message",
  "source": "/home/eelt-dev/INTROOT/logsink/test_logs_1.log"
}
In addition to inputs and outputs, it also allows for further Filebeat options customization.
A basic example configuration that harvests log files from the logsink directory and sends them to a Logstash instance running in host logstashhost on port 5044 is shown in Listing 6‑2.
This example includes the following sections:
Queue
Inputs
Outputs
Logging level
HTTP metrics endpoint
Filebeat supports buffering of events between the harvesting and shipping stages. This allows for batch processing of events by the output, being able to do bulk operations to send batches of logs in a single transaction. It is configured in the queue section.
In the inputs section, multiline options can be defined as well. This allows for harvesting log events that span across multiple lines as a single log event. In the CII Log case, this is used for log events that include stack traces. Specific multiline configuration for CII log events is shown in Listing 6‑2. For further details on multiline options, refer to the Filebeat documentation [13].
It is possible to define the log level for the logs produced by the Filebeat process by setting the property logging.level to the desired level. If this property is not set, the default value used is INFO.
The http.enabled property is used to enable the Filebeat HTTP endpoint. Usage of this endpoint to obtain Filebeat metrics is described in section 6.3.1.
By default, the internal Filebeat logs are output in rotating files in /var/log/filebeat directory (see Table 6‑1).
Listing 6‑2 Basic Filebeat configuration
#================================ General ====================================
# Internal queue configuration for buffering events to be published.
queue:
  # Queue type by name (default 'mem')
  # The memory queue will present all available events (up to the outputs
  # bulk_max_size) to the output, the moment the output is ready to process
  # another batch of events.
  mem:
    # Max number of events the queue can buffer.
    events: 4096

    # Hints the minimum number of events stored in the queue,
    # before providing a batch of events to the outputs.
    # The default value is set to 2048.
    # A value of 0 ensures events are immediately available
    # to be sent to the outputs.
    flush.min_events: 500

    # Maximum duration after which events are available to the outputs,
    # if the number of events stored in the queue is < min_flush_events.
    flush.timeout: 1s

#=========================== Filebeat inputs =============================
# This input defines which files will be harvested and the rules to do so
filebeat.inputs:

  - type: log

    # Set to true to enable this input configuration.
    enabled: true

    # Paths that should be crawled and fetched. Glob based paths.
    paths:
      - ${CIISRV_ROOT}/logsink/*.log

    ### Multiline options

    # Multiline can be used for log messages spanning multiple lines, like
    # CII log messages including an error trace
    # This pattern matches any line starting with Cref
    multiline.pattern: ^Cref

    # Defines if the pattern set under pattern should be negated or not.
    multiline.negate: true

    # Match is set to "after" to tell logstash to append lines that don’t
    # match the pattern to the last matched line
    multiline.match: after

    # This value defines the time after which new lines not matching the
    # pattern will stop being appended to the last event and will
    # start being processed as new events
    multiline.timeout: 1s

#================================ Outputs ====================================
# Configuration of Logstash output to use when sending the data collected.
output.logstash:
  # The Logstash hosts
  hosts: ["logstashhost:5044"]

#================================ Logging ====================================
# Sets log level. The default log level is info.
# Available log levels are: error, warning, info, debug
logging.level: debug

#================================ HTTP Endpoint ==============================
# Defines if the HTTP endpoint is enabled.
http.enabled: true
9.5.1.2. Directory structure
Filebeat uses different directories to run. These directories follow the layout described in Table 6‑1.
Table 6‑1 Filebeat directory structure
Dir |
Description |
Default location |
Config option |
|---|---|---|---|
home |
Home of the Filebeat installation |
/usr/share/file beat |
path.home |
bin |
The location for the binary files |
/usr/share/file beat/bin |
|
config |
The location for the configuration files |
/etc/filebeat |
path.config |
data |
The location for persistent data files |
/var/lib/filebe at |
path.data |
logs |
The location for the logs created by Filebeat |
/var/log/filebe at |
path.logs |
These default locations are applied when Filebeat is started as a systemd service. If Filebeat is started as a regular command-line process it will use the installation directory /usr/share/filebeat as path.home unless provided in the configuration options.
Path configuration options can be defined as command-line arguments or in the Filebeat configuration file.
If any of the other path configuration options are not provided, the default values shown in Table 6‑2 will be used.
Table 6‑2 Filebeat default path properties values
Dir |
Default |
Config option |
|
|---|---|---|---|
home |
path.home |
||
bin |
{path.home}/bin |
||
config |
{path.home}/config |
path.config |
|
data |
{path.home}/data |
path.data |
|
logs |
{path.home}/logs |
path.logs |
By default, Filebeat configuration file is located in the {path.home}/config directory with filename filebeat.yml.
The location of the Filebeat configuration file can be also defined in command line using the -c / –c option, e.g:
$ filebeat -c /path/to/my/filebeatconfig.yml
This is an example command line input to start Filebeat defining custom values for all path configuration options. It will look for configuration files in the /home/eelt-dev/filebeat_config directory
$ filebeat –path.home /usr/share/Filebeat \
>  --path.configs /home/eelt-dev/filebeat_config \
>  --path.data /home/eelt-dev/filebeat_data \
>  --path.logs /home/eelt-dev/filebeat_logs
9.5.2. Logstash
Logstash processes log events as a pipeline. The Logstash pipeline architecture is shown in Figure 6‑1 and consists of these stages:
Inputs. These elements receive log events. In the CII Logging architecture (Figure 2‑2), events can be received from a Filebeat instance or from another Logstash instance.
Filters. Are used to process events. Here is where raw CII Log events sent by Filebeat are parsed and their individual fields extracted.
Outputs. In this stage, the processed events can be sent to any number of outputs
Codecs are used on the inputs and outputs to handle different types of serialization, such a JSON, single-line string, or multi-line string. Unless stated otherwise, all inputs and outputs use a JSON codec by default.
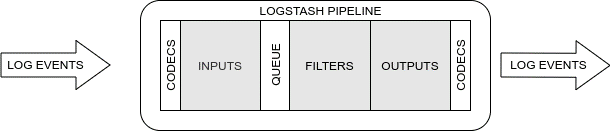
Figure 6‑1 Logstash pipeline architecture
A default setup for Logstash in the CII Logging system consists of multiple Filebeat instances collecting logs and sending them to a Logstash instance, which then persists the received log events to Engineering Archive as depicted on Figure 6‑2.
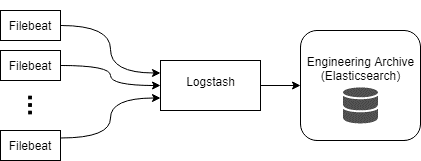
Figure 6‑2 Typical log events data flow
A configuration for Logstash for this default CII configuration is shown in Listing 6‑4. Example events before and after being processed by Logstash are shown in Listing 6‑1 and Listing 6‑3 respectively
Listing 6‑3 Example Logtash parsed log event output
{
    "source" => "/home/eelt-dev/INTROOT/logsink/test_logs_1.log ",
    "beat" => {
         "name" => "docker-eso-eelt",
         "version" => "6.8.6",
         "hostname" => "docker-eso-eelt"
    },
    "tags" => [
        [0] "beats_input_codec_plain_applied"
    ],
    "prospector" => {
        "type" => "log"
    },
    "@timestamp" => 2020-01-28T17:51:12.906+0100,
    "log" => {
        "file" => {
            "path" => "/home/eelt-dev/INTROOT/logsink/test_logs_1.log "
        }
    },
    "message" => "Test TRACE log message",
    "@version" => "1",
    "host" => {
        "name" => "docker-eso-eelt"
    },
    "offset" => 0,
    "input" => {
        "type" => "log"
    },
    "cii" => {
        "sourceid" => "elt.log.testing.LogProducer/main",
            "date" => "2020-01-28T17:51:12.906+0100",
         "logtype" => "TRACE",
           "logid" => "elt.log.testing.LogProducer.main-16",
            "cref" => "LogProducer.java-16",
         "message" => "Test TRACE log message",
        "hostname" => "docker-eso-eelt"
    }
}
In the input section, a single beats input plugin is configured. This input will use the 5044 port to receive log events from the Filebeat instances.
The filter section of this example is composed of three filter plugins: grok, mutate, and date.
As mentioned earlier, Filebeat will serialize the logs as JSON objects, but the collected raw logs from the logsink directory will be passed to Logstash as a whole string in the message field of the JSON object. It is the responsibility of Logstash to parse that string and extract the appropriate fields. To do so, a CIILOG pattern installed in ${CIISRV_ROOT}/etc/log/logstash/patterns matching the CII Log format is used by the grok filter plugin. Since it’s a custom pattern, the path to the directory containing the file with the CIILOG pattern definition must be passed to the grok filter by setting the patterns_dir option to the appropriate path.
If the string in the event’s message field fails to match the pattern, a _grokparsefailure tag will be added to the tags field of the log event and no fields will be extracted.
After parsing the log, if the tag _grokparsefailure is not found in the tags field, the event is further processed, otherwise is passed directly to the outputs. In the example configuration provided in Listing 6‑4, these log messages would be persisted to the same index as the rest of the log events, but only containing the “message” field, which wraps the whole unparsed log event. This behaviour is completely configurable. An additional output could be configured to a specific ES index for failed parsing log messages.
The cii.message field is copied to the message field with the mutate filter, replacing the original unparsed log string.
Next, the cii.date field is parsed and copied to the @timestamp field of the event, which by default is set to the time the event gets processed by the Filebeat instance, rather than the original time of the event.
Finally, the output section contains a single Elasticsearch output plugin. It has two parameters defined:
hosts – Defines the Elasticsearch instances to which it will write the log events. In this case, ciilogelastichost.
index – The index to which the log events will be written. This configuration uses a pattern that includes the current date, e.g. cii_log-2020.06.10. This is a recommended good practice in order to avoid log indices from growing indefinitely. Usage of these patterns is discussed in more detail in section 6.2.2.
Listing 6‑4 Default Logstash CII configuration
# Default Logstash CII configuration
# Filebeat -> Logstash -> Elasticsearch.

input {
  beats {
    port => 5044
  }
}

filter {
  grok {
    patterns_dir => ["${CIISRV_ROOT}/etc/log/logstash/patterns"]
    match => { "message" => "%{CIILOG}" }
  }
  if "_grokparsefailure" not in [tags] {
    mutate {
      copy => {"[cii][message]" => "message"}
    }
    date {
      match => [ "[cii][date]", "ISO8601" ]
    }
  }
}

output {
  elasticsearch {
    hosts => ["ciilogelastichost"]
    index => "cii_log-%{+YYYY.MM.dd}"
  }
}
9.5.2.1. Forwarding log events
Another typical use case consists of a Logstash instance that forwards log events to another Logstash instance, as depicted in Figure 6‑3.
In this use case, both Logstash instances receive events from different Filebeat instances, but instance 1 forwards the processed events to instance 2, which persists all received events to the Engineering Archive.
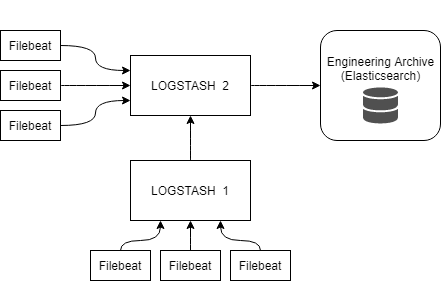
Figure 6‑3 Logstash forwarding events
Configuration for Logstash instance 1 is shown in Listing 6‑5 Logstash upstream forwarding configuration. The only difference with the default configuration seen in the previous section (Listing 6‑4) is the outputs configuration, which is coloured in orange.
In this case, a lumberjack output plugin is used with the following configuration:
hosts – The Logstash instance on ciilogstashhost hostname where events will be forwarded to (instance 2).
ssl_certificate – Path to SSL certificate to use to connect to the downstream Logstash (instance 2). Forwarding between Logstash instances requires using a secured SSL connection. More information on the SSL configuration can be found in the Logstash documentation [9].
port – TCP port on the downstream Logstash instance where events will be sent to.
Listing 6‑5 Logstash upstream forwarding configuration
# Logstash configuration for creating a simple
# Filebeat -> Logstash -> Logstash pipeline.

input {
  beats {
    port => 5044
  }
}

filter {
  grok {
    patterns_dir => ["${CIISRV_ROOT}/etc/log/logstash/patterns"]
    match => { "message" => "%{CIILOG}" }
    overwrite => ["message"]
  }
  if "_grokparsefailure" not in [tags] {
    mutate {
      copy => {"[cii][message]" => "message"}
    }
    date {
      match => [ "[cii][date]", "ISO8601" ]
    }
  }
}

output {
  lumberjack {
    codec => json
    hosts => "ciilogstashhost"
    ssl_certificate => "/path/to/cert/lumberjack.cert"
    port => 5045
  }
}
The configuration for the Logstash instance 2 is shown in Listing 6‑6. In this case there are two differences with the default Logsatsh configuration example from Listing 6‑4.
In the inputs section, two beats input plugins are configured. The first one to receive events from Filebeat instances, and the second one to receive events forwarded from other Logstash instances using the lumberjack protocol. SSL is enabled and fields for SSL certificate and key files are provided.
The second difference is in the filters section. Events that have been forwarded by another Logstash instance have already been processed. Therefore, it is not necessary to process them again. To avoid so, it checks if cii.logtype field is defined. If it’s not, it means that the event hasn’t been processed yet. In this case it is then passed to the filter plugins, otherwise it is sent directly to the outputs.
Listing 6‑6 Logstash downstream forwarding configuration
# Logstash configuration for creating a
# Filebeat/Logstash -> Logstash -> Elasticsearch pipeline.

input {
  # Input for Filebeat
  beats {
    port => 5044
  }
  # Input for Logstash forwarding
  beats {
    codec => json
    port => 5045
    ssl => true
    ssl_certificate => "/path/to/cert/lumberjack.cert"
    ssl_key => "/path/to/cert/lumberjack.key"
  }
}

filter {
  if ! [cii][message]
    grok {
      patterns_dir => ["${CIISRV_ROOT}/etc/log/logstash/patterns"]
      match => { "message" => "%{CIILOG}" }
      overwrite => ["message"]
    }
    if "_grokparsefailure" not in [tags] {
      mutate {
        copy => {"[cii][message]" => "message"}
      }
      date {
        match => [ "[cii][date]", "ISO8601" ]
      }
    }
  }
}

output {
  elasticsearch {
    hosts => ["ciilogelastichost"]
    index => "cii_log-%{+YYYY.MM.dd}"
  }
}
9.5.2.2. Persisting Log events
As mentioned earlier, it is a good practice to define time-based indices for our logs, in the same fashion regular logging rotates log files using time-based policies.
For example, the index in a Logstash output plugin configuration can be configured as cii_log-%{+YYYY.MM.dd}. Which will produce indices with the current date appended to the name of the index (e.g. cii_log-2020.06.10).
This feature can be used to further manage log events in indices based on their audience. Listing 6‑7 shows an example output configuration that uses a pattern including the cii.audience field value to persist the event in different audience-based indices. Events with an audience field defined will be stored in indices following the pattern cii_log-%{[cii][audience]}-%{+YYYY.MM.dd} (e.g. cii_log-DEVELOPER-2020.06.10 or cii_log-OPERATOR-2020.06.10). Events with no audience defined will be stored in indices following the pattern cii_log-ALL-%{+YYYY.MM.dd} (e.g. cii_log-ALL-2020.06.10).
A similar approach can be taken with other CII Log fields, such as cii.logtype.
Listing 6‑7 Audience-based output configuration
output {
  if ! [cii][audience] {
    elasticsearch {
      hosts => ["ciilogelastichost"]
      index => "log-ALL-%{+YYYY.MM.dd}"
    }
  } else {
    elasticsearch {
      hosts => ["ciilogelastichost"]
      index => "cii_log-%{[cii][audience]}-%{+YYYY.MM.dd}"
    }
  }
}
9.5.2.3. Handling Log Events
It is possible to handle events based on the value of any of their fields. One example use case of event handling would be a situation where we want logs of levels TRACE and DEBUG to be saved to a local Elasticsearch instance, and events with a level above DEBUG to be persisted to a remote Elasticsearch instance (e.g. Engineering Archive). An output configuration for this use case is shown in Listing 6‑8 Logtype-based output configuration.
Listing 6‑8 Logtype-based output configuration
output {
  if [cii][logtype] in ["TRACE", "DEBUG"] {
    elasticsearch {
      hosts => ["localhost"]
      index => "cii_log-%{+YYYY.MM.dd}"
    }
  } else {
    elasticsearch {
      hosts => ["ciilogelastichost"]
      index => "cii_log-%{+YYYY.MM.dd}"
    }
  }
}
9.5.2.4. Configuring Logstash
The directory layout of a Logstash installation is shown in Table 6‑3.
By default, when configuring pipelines, Logstash will try to load all the files with .conf extension from the conf directory. This can be overridden when running Logstash from the command line using the -f flag with the path of the configuration file we want to load:
$ logstash -f <path_to_config_file>
The settings directory contains the logstash.yml file. This file is used to define configuration flags for Logstash. It allows defining batch sizes for the pipelines, queue type, and settings, or paths to the different configuration directories described in Table 6‑3.
Additional information on the logstash.yml file can be found in the Logstash documentation
Table 6‑3 Logstash directory structure
Type |
Description |
Default Location |
Setting |
|---|---|---|---|
home |
Home directory of the Logstash installation |
/usr/share/logs tash |
|
bin |
Logstash executables directory |
/usr/share/logs tash/bin |
|
settings |
Configuration files, including logstash.yml, jvm.options, and startup.options |
/etc/logstash |
path.settings |
conf |
Logstash pipeline configuration files |
/etc/logstash/c onf.d/*.conf |
Defined in /etc/logstash/p ipelines.yml |
logs |
Log files generated by Logstash |
/var/log/logsta sh |
path.logs |
plugins |
Local plugin files |
/usr/share/logs tash/plugins |
path.plugins |
data |
Data files used by Logstash and its plugins for any persistence needs. |
/var/lib/logsta sh |
path.data |
9.5.2.5. Using multiple pipelines
Logstash supports using multiple pipelines. This allows for modularization and encapsulation of responsibilities. Pipelines can work independently or they can be connected to each other, allowing to effectively split the processing of a log event in different pipelines.
In Figure 6‑4 an example setup with multiple pipelines is shown. This example consists of three pipelines:
logsink-input: This pipeline is responsible for receiving log events from the Filebeat instances.
forwarded-input: This pipeline is responsible for receiving log events forwarded by another Logstash instance.
ea-output: This pipeline is responsible for persisting to the Engineering Archive log events passed on by any of the input pipelines.
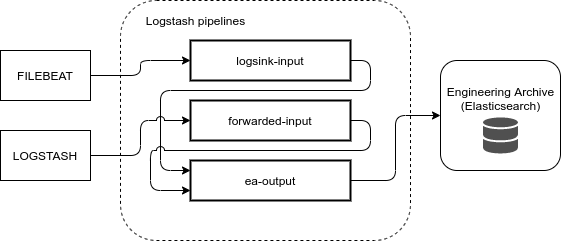
Figure 6‑4 Multiple pipeline Logstash setup
Configuration of Logstash pipelines is done through the pipelines.yml file. This file must be placed in the path.settings directory. Configuration for each pipeline can be provided as a string in the pipelines.yml configuration, as shown in Listing 6‑9. It is also possible to define the paths to the individual pipeline, as shown in Listing 6‑10.
Listing 6‑9 Logstash multiple pipelines string configuration
# config/pipelines.yml
- pipeline.id: logsink-input
  config.string: |
    input {
      beats {
        port => 5044
      }
    }
    filter {
      grok {
        patterns_dir => ["${CIISRV_ROOT}/etc/log/logstash/patterns"]
        match => { "message" => "%{CIILOG}" }
        overwrite => ["message"]
      }
      if "_grokparsefailure" not in [tags] {
        mutate {
          copy => {"[cii][message]" => "message"}
        }
        date {
          match => [ "[cii][date]", "ISO8601" ]
        }
      }
    }
    output {
      pipeline { send_to => ea-output }
    }
- pipeline.id: forwarded-input
  config.string: |
    input {
      beats {
        codec => json
        port => 5045
        ssl => true
        ssl_certificate => "/path/to/cert/lumberjack.cert"
        ssl_key => "/path/to/cert/lumberjack.key"
      }
    }
    output {
      pipeline { send_to => ea-output }
    }
- pipeline.id: ea-output
  config.string: |
    input { pipeline { address => ea-output } }
    output {
      elasticsearch {
        hosts => [es_cluster_b_host]
      }
    }
Listing 6‑10 Logstash multiple pipelines path configuration
# config/pipelines.yml
- pipeline.id: logsink-input
  path.config: "/path/to/config/logsink-input.conf"
- pipeline.id: forwarded-input
  path.config: "/path/to/config/forwarded-input.conf"
- pipeline.id: ea-output
  path.config: "/path/to/config/ea-output.conf"
9.5.2.6. Persistent queues
Logstash supports buffering of events in queues. These queues are located between the input and the filter stages, as shown in Figure 6‑1. By default, Logstash uses an in-memory queue, but it can be configured to use persistent queues, which will buffer the received events in a file.
Using persistent queues has two main benefits. It helps absorbing bursts of events that can not be processed at the same rate as they are receive; and helps avoiding loss of events in case of an abnormal termination of the Logstash service, since those buffered events will be processed once the Logstash service is started again.
Configuration of persistent queues is defined in the logstash.yml settings file. An example configuration is shown below. This configuration defines a persistent queue with a limit of 2000 buffered events.
queue.type: persisted
queue.max_events: 2000
It is possible to define other parameters, like the maximum size in bytes of the buffer, or the location of the queue data files.
Additional information on persistent queues can be found in the Logstash documentation [12].
9.5.3. Logging Services Statistics
It is possible to obtain internal metrics data for the Filebeat and the Logstash instances by configuring and querying their Metrics HTTP endpoints. The responses are encoded as JSON objects.
9.5.3.1. Filebeat Metrics HTTP Endpoint
Filebeat exposes internal metrics through an HTTP endpoint.
By default, the Metrics endpoint is disabled, but can be enabled and configured in the Filebeat configuration through the setting described in Table 6‑4.
Table 6‑4 Filebeat HTTP Metrics endpoint properties
Property |
Description |
Default value |
|---|---|---|
http.enabled |
Enables the HTTP endpoint |
false |
http.host |
Binds to this hostname |
localhost |
http.port |
The HTTP endpoint will bind to this port |
5066 |
Two types of queries can be performed:
Basic info
Advanced stats
The following example queries show how the metrics can be queried. First for the basic info:
$ curl -XGET 'localhost:5066/?pretty'
And then for the advanced stats
$ curl -XGET 'localhost:5066/stats?pretty'
Additional information and output examples can be found in the Filebeat documentation [8].
9.5.3.2. Logstash Monitoring APIs
The metrics provided by Logstash are more exhaustive than the ones provided by Filebeat. While Filebeat only offers one endpoint, Logstash offers one endpoint for each of the different Monitoring APIs it offers, as shown in Table 6‑5.
Table 6‑5 Logstash monitoring APIs
Metrics API |
Description |
Endpoint name |
|---|---|---|
Node Info |
Retrieves information about the node. Supports the following node types:
|
/_node/<types> |
Plugins Info |
Retrieves information about the currently installed Logstash plugins. |
/_node/plugins |
Node Stats |
Retrieves runtime information about the Logstash process. Supports the following node types:
|
/_node/stats/<types> |
Hot Threads |
Retrieves information about the current hot threads for Logstash. A hot thread is a Java thread that has high CPU usage and executes for longer than a normal period of time. |
/_node/hot_threads |
In addition to these resources, the root endpoint can be queried to obtain general information about the Logstash instance, as is shown in the query and response below. The ?pretty parameter is optional for any of the queries, and if used the JSON response object from Logstash is pretty-printed, instead of being returned as a one-line JSON.
curl -XGET logstashhost:9600/?pretty
9.5.3.2.1. Configuring Monitoring APIs port
By default, the Logstash Monitoring API is bound to the port 9600, but it is possible to override this value and set it to a custom TCP port number with the command line flag –http.port.
Additional information on the Monitoring APIs can be found in the Logstash documentation [7].
9.6. Logging User Tools
This section describes the different user interface tools that enable users to create, query, and browse CII Log events.
9.6.1. logSend
This section describes how to use the logSend command line tool. This tool allows a user to create a log entry in the logsink directory, where it can be collected by the CII Logging transmission and management subsystem. The tool will create a file with the name eltdev-log-output-logsend-<current_date>.log and append the log message to it.
This tool takes the Message field value and accepts parameters for all the rest of the CII Log format fields as described in Appendix B. For the required fields, the “N/A” value is used if no value is provided, except for the LogType field, for which the INFO level will be used, and for the HostName field, for which the current hostname will be used. The Date field is populated with the current time. Table 5‑1 shows the mappings beteen the sendLog command flags and the CII Log fields.
Table 6‑1 sendLog CLI tool flags mappings
Flag |
Field name |
|---|---|
-h, –help |
|
-lt, –logtype |
LogType |
-cr, –cref |
Cref |
-si, –sourceid |
SourceID |
-h, –hostname |
HostName |
-au, –audience |
Audience |
-uli, –userlogid |
UserLogID |
-ti, –traceid |
TraceID |
-spi, –spanid |
SpanID |
-en, –exceptionname |
ErrorTypeName |
-ed, –exceptiontimestamp |
ErrorDateTime |
-em, –errormessage |
ErrorMessage |
-et, errortrace |
ErrorTrace |
A basic usage example can be seen below:
$ logSend "This is a log message"
Which will create the following log:
Cref=N/A, Date=2020-03-27T19:44:57.872+0200, HostName=docker-eso-eelt, LogType=INFO, SourceID=N/A, LogID=N/A, Message=This is a log message
This is a more advanced example, where several of the log fields are passed as arguments:
$ logSend "This is a log message" -lt ERROR -cr example_code_reference -si  \
example_source_id -li example_log_id -au DEVELOPER
Which will produce the following log:
Cref=example_code_reference, Date=2020-03-27T19:50:28.739+0200, HostName=docker-eso-eelt, LogType=ERROR, SourceID=example_source_id, LogID=example_log_id, Message=This is a log message, Audience=DEVELOPER
9.6.2. Log Viewer
This section describes usage of the ciiLogViewer application, which is a graphical viewer application for logs.
In “follow” mode, it detects all newly created log messages on the local host, found in the local log sink directory (defined by $CII_LOGS), and displays them in an automatically refreshing table.
The tool is new in version 2.0 of CII Services, and in this version only supports a limited set of features.
Table 6‑2 log viewer command line options
Flag |
Description |
|---|---|
-h, –help |
Shows help |
-f, –follow |
Display (tail) new local logs |
9.6.3. Log Viewer Widget (Qt)
This is a Qt widget, meant for integration into an ELT application, allowing to display and filter ELT log data. Log data can be stored locally (i.e. in log files) or remotely (i.e. in Elasticsearch server). It also allows the user to create a log entry in the local logsink directory.
To start a demo application containing the widget, run the qt-widgets-log-dialog-sample-app command from a terminal. When the widget is displayed by an application, it opens the main window in local mode. Initially two files are open: the most recently modified file from $CIISRV_ROOT/logsink directory and the default output file for current date in the same directory. The default output file is used as default destination by the widget when an ad-hoc log entry is created. This file name follows the pattern default-eeltdev-output-{YYYYMMDDHHMMSS}.log.
9.6.3.1. Main Window
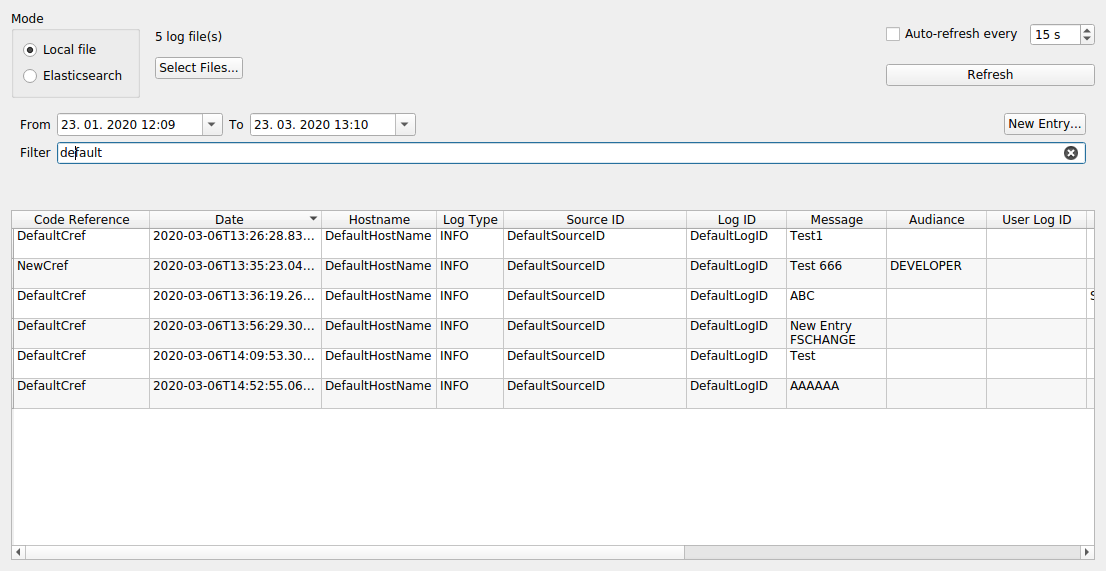
Figure 6‑1 LogViewer main window (Local)
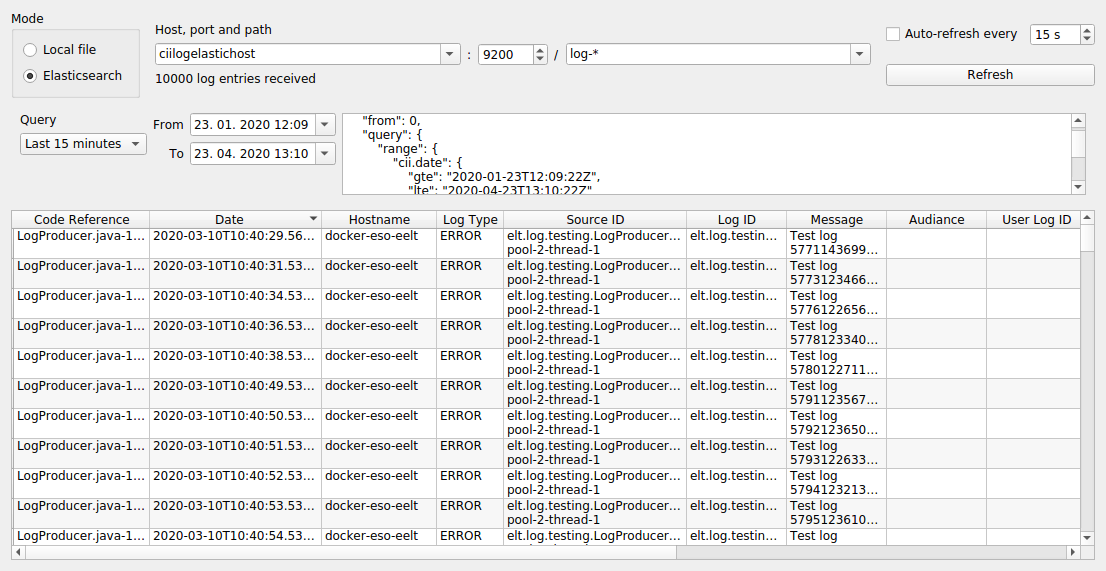
Figure 6‑2 LogViewer main window (Remote)
The main window contains four major parts:
The Mode toggle control is located in the upper-left corner. It allows switching between a local file and Elasticsearch mode. In Local file mode, the log entries are read from local log files. In Elasticsearch mode, log entries are retrieved from an Elasticsearch server (local or remote). It is possible to use a search query to filter the browsed log events.
To the right of the mode selection controls, some information is displayed about the current mode. Mode-specific settings are displayed as well next to the mode selection controls.
In local mode, you can see the number of open log files (if you hover the mouse over the label you can see the list of file paths in the tooltip). To select log files that are open, click the Select Files button.
In Elasticsearch mode this part displays host name/address, port, and path for the server. You can edit those fields and when a query succeeds new host and path are added to the drop-down list for quick future selection. The label below server settings displays the basic status of query and possible network errors.
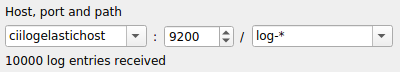
Figure 6‑3 Log Widget remote mode settings
The Refresh controls are located in the upper-right corner. The Refresh button can be clicked to manually retrieve the log data from an appropriate source and re-display it in the log entries table. To enable periodic automatic refresh of the log data, tick the Auto-refresh option, and enter the desired time period in seconds. This time will be used as the refresh frequency for the logs data. When this option is enabled in local mode, it also enables refreshing of log’s data each time a displayed log file is changed on the hard disk (when some external tool or application writes to it).
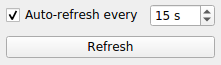
Figure 6‑4 Log Widget refresh controls
In the middle part, Filtering and query controls are located. These differ depending on the current mode and are described in section 7.1.2.
At the bottom of the window, log entry data is shown in a table. By default, log entries are sorted by date ascending, but sorting can be customized. To sort by any of the log properties click on the different column headers. To resize the width of a column to the longest value in that column, double-click on a header separator at the right edge of the column.
9.6.3.2. Filter and query controls
When the application is in local mode these are the controls displayed:

Figure 6‑5 Local mode filter controls
Use From/To date and time picker to set the time period of displayed log entries. Time is displayed in UTC. You can change time/date by entering any part directly using the keyboard, or using mouse scrolling to increase/decrease the value of the selected part. The date can also be selected with a date drop down menu, which you can display by clicking the arrow button.
To filter display of log entries by desired text, enter the desired text
into Filter field. Filtering is not case-sensitive. This field also
accepts grep-like regular expressions. When filtering by specific log
entry property, the original names are used. You can see the original
name in a tooltip, displayed when you hover the mouse cursor over the
column header. You can also see the list of all original property names
in the context help for the Filter field. To display the context help,
press Shift+F1 with the field focused or use the question-mark button
 from window title bar, if available. Note that not all windows
managers are able to display this button.
from window title bar, if available. Note that not all windows
managers are able to display this button.
To add a new entry into a local log file in the $CIISRV_ROOT/logsink directory click on the New Entry button and a new dialog window will be opened. For details about it see the section below.
In global mode the controls are a bit different:
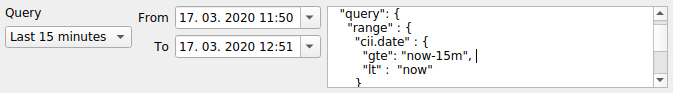
Figure 6‑6 Remote mode query controls
The Query dropdown list enables to select a predefined Elasticsearch query. When desired query is selected, it is copied to the query text area on the right. You can edit it, before submitting it by clicking the Refresh button.
The From/To date and time fields behave the same way as in the local mode. When the date or time values are modified, the query text area on the right will also reflect these changes by updating the cii.date field range constraint.
The query text area on the right and enables to edit the entire Elasticsearch query as needed.
9.6.3.3. Adding new local log file entry to logsink
When New Entry button is clicked in local mode, a dialog window opens. The log message you would like to append to a local log file is entered into a text field in the top half of the dialog. The message is mandatory and the Send button will only be enabled if you enter some message text.
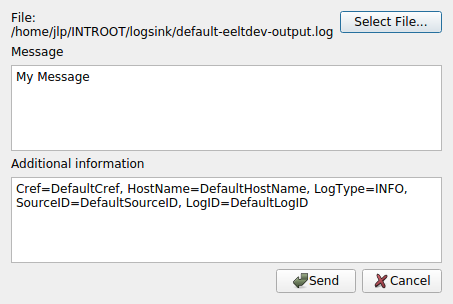
Figure 6‑7 Send log message dialog
An additional information text box can be used to set other log entry property fields. These must be set in the form of “property=value”. Note that some property fields (e.g. Cref) are mandatory. These are filled out in advance in this text field with their default values. It is recommended you change them as needed. For information about all available property fields, you can consult the contextual tooltip help for this field and also Appendix B. To access it use the question-mark/button at the window title bar.
When you are finished with the message and additional information, click the Send button to append the log entry to the end of the local log file, or the Cancel button to close the dialog without appending any entry.
9.6.4. Logtrail
Logtrail can be accessed in a browser by navigating to the appropriate Kibana URL (eg: http://ciikibanahost:5601). Access to the Logtrail app can be found in the left-side menu of the Kibana GUI. It is also possible to navigate directly to the URL app (e.g.: http://ciikibanahost:5601/app/logtrail)
To use Logtrail log browser, two configurations need to be in place:
Kibana index patterns
Logtrail configuration
9.6.4.1. Kibana index patterns
Index patterns [18] are used to define the Elasticsearch log indices that are available for exploring. Index patterns settings can be found in Kibana Management app, available on the left-side menu of the Kibana GUI.
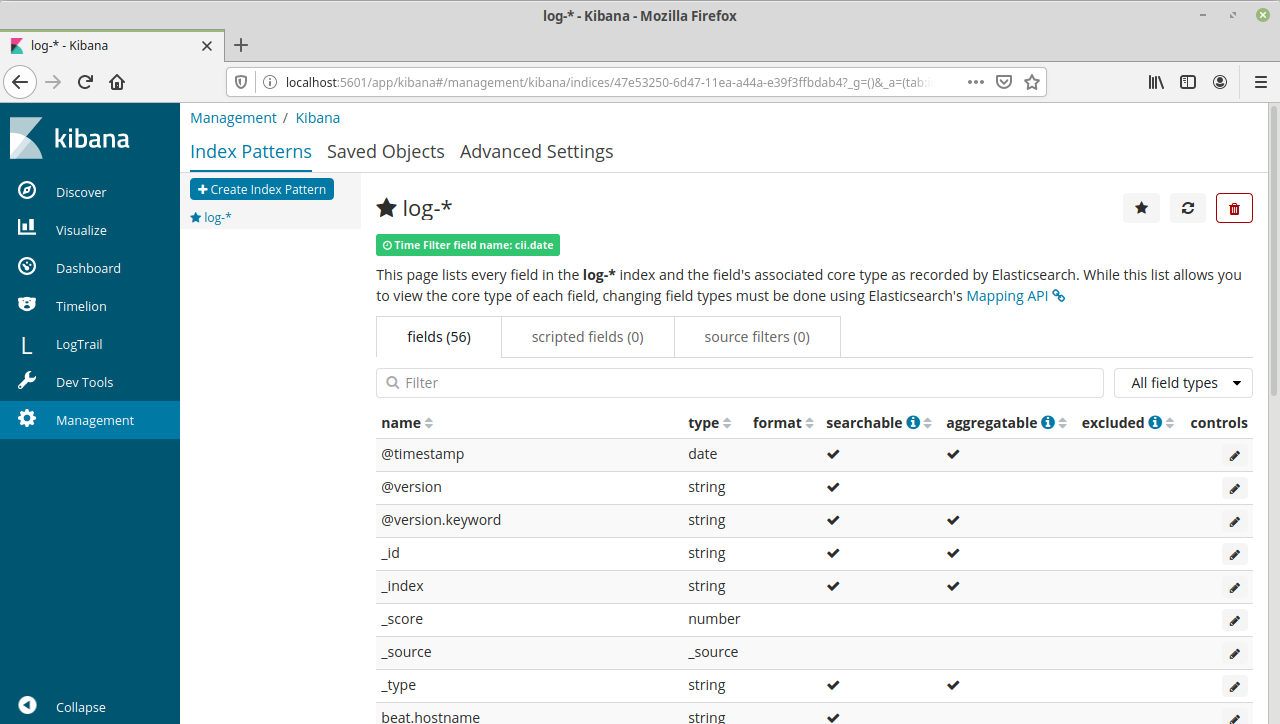
Figure 6‑8 Kibana Index Patterns view
When creating an index pattern for CII logs it is important to select cii.date as the time filtering field, otherwise, it will use the default @timestamp field. This setting is primarily used to order all the log events being queried from the different Elasticsearch indices matched by the pattern.
For example, if log index patterns are defined as shown in section 7.2.3. following the pattern log-%{AUDIENCE}-%{+YYYY.MM.dd}, it can be useful to define patterns like:
cii_log-* : Provides access to all log indices in the Elasticsearch instance
cii_log-DEVELOPER-* : Provides access to all log indices for DEVELOPER audience.
remoteciilogelastichost:cii_log-: Provides access to all logs in remoteciilogelastichost remote Elasticsearch cluster.
Additional information can be found in the Kibana documentation [18].
9.6.4.2. Cross-cluster search
Kibana supports searches across remote Elasticsearch clusters. To enable cross-cluster search, the appropriate remote clusters must be configured in the local Elasticsearch cluster.
Remote clusters can be configured as persistent or transient. If the remote cluster is configured as persistent, the configuration will be persisted between restarts of the Elasticsearch cluster, while a transient remote cluster configuration won’t be available after a full cluster restart.
For each remote cluster, a name is defined, and at least a seed must be provided. These seeds are hosts belonging to the remote cluster being configured. For each seed, a host must be provided, as well as the Elasticsearch transport port for that host. The transport port is used for communication between Elasticsearch nodes and is set to port 9300 by default. It must not be confused with the Elasticsearch HTTP API port, which is set by default to port 9200.
In the example below, a transient remote cluster with name remoteciilogelastichost on host ciilogelastichost is added to a local cluster.
Listing 6‑1 Configuring a remote cluster for cross-cluster search
curl -X PUT "localhost:9200/_cluster/settings?pretty" \
-H 'Content-Type: application/json' -d'
{
  "transient": {
    "search": {
      "remote": {
        "remoteciilogelastichost": {
          "seeds": [
            "ciilogelastichost:9300"
          ]
        }
      }
    }
  }
}
'
To remove a remote cluster configuration, the seeds must be set to null, as shown in the example . If the remote cluster configuration contains any optional settings, these settings must be set to null as well
Listing 6‑2 Removing a cross-cluster search remote cluster configuration
curl -X PUT "localhost:9200/_cluster/settings?pretty" \
-H 'Content-Type: application/json' -d'
{
  "transient": {
    "search": {
      "remote": {
        "remoteciilogelastichost": {
          "seeds": null
        }
      }
    }
  }
}
'
Addditional information on cross-cluster search can be found in the Kibana documentation [21].
9.6.4.3. Logtrail configuration
Logtrail can be configured through logtrail.json file located in Logtrail plugin directory /usr/share/kibana/plugins/logtrail/. It also supports configuration through Elasticsearch.
At Kibana start-up, Logtrail will automatically look for a configuration. First, it will look in the .logtrail index in the Elasticsearch. If a valid configuration is found, it will be used. Otherwise, the one from the logtrail.json file will be used.
Changes in logtrail.json file configuration require Kibana service to be restarted. If Elasticsearch configuration is used, it will be reloaded automatically by accessing or refreshing the Logtrail app page.
To write a configuration to the Elasticsearch, the command shown in Listing 7‑3 can be used. In that command, elasticsearch_host should be replaced with the correct Elasticsearch instance hostname or IP, and path_to_logtrail.json_file with the path to the file containing the Logtrail configuration to be saved to Elasticsearch.
Listing 6‑3 Saving Logtrail config to ES command
curl -XPUT '<elasticsearch_host>:9200/.logtrail/config/1?pretty' \
-H 'Content-Type: application/json' \
-d@<path_to_logtrail.json_file>
An example Logtrail configuration for CII logs can be found in Listing 7‑4. This configuration is defined for index pattern log-*.
It is possible to define configuration for multiple index patterns. Each index pattern will have its own separate configuration. Switching between different index-pattern configurations is performed through the Logtrail app. The example in Listing 7‑5 shows a configuration for index patterns log-* and log-DEVELOPER-*.
Mappings for Logtrail fields timestamp, hostname, program and message are required. From these fields, the ones mapped as timestamp, hostname, and program will be displayed first for each displayed log event on the Logtrail app. The fields following those are configured through the message_format field. This field allows to define a pattern for the fields displayed for the log events.
It is also possible to define colours for the message field based on the values of another field. In the provided examples, the cii.logtype field is used to apply different colours to the message field based on the severity of the log event.
Listing 6‑4 Logtrail configuration example
{
  "version" : 2,
  "index_patterns" : [
    {
      "es": {
        "default_index": "log-*"
      },
      "tail_interval_in_seconds": 10,
      "es_index_time_offset_in_seconds": 0,
      "display_timezone": "local",
      "display_timestamp_format": "YYYY-MM-DDTHH:mm:ss.SSSZ",
      "max_buckets": 500,
      "default_time_range_in_days" : 0,
      "max_hosts": 100,
      "max_events_to_keep_in_viewer": 5000,
      "default_search": "",
      "fields" : {
        "mapping" : {
            "timestamp" : "cii.date",
            "hostname" : "cii.hostname",
            "program": "cii.sourceid",
            "message": "cii.message"
        },
        "message_format": "{{{cii.cref}}} | {{{cii.logid}}} | {{{cii.logtype}}} | {{{cii.message}}} | {{{cii.audience}}} | {{{cii.userlogid}}} | {{{cii.traceid}}} | {{{cii.spanid}}} |  {{{cii.error.typename}}} | {{{cii.error.datetime}}} | {{{cii.error.message}}} | {{{cii.error.trace}}}",
        "keyword_suffix" : "keyword"
      },
      "color_mapping" : {
        "field": "cii.logtype",
        "mapping": {
          "FATAL": "#FF0000",
          "ERROR": "#FF9933",
          "WARN": "#FFFF66",
          "INFO": "#B5E7A0",
          "DEBUG": "#FFFFFF",
          "TRACE": "#CFE0E8"
        }
      }
    }
  ]
}
Listing 6‑5 Multiple index patterns Logtrail configuration example
{
  "version" : 2,
  "index_patterns" : [
    {
      "es": {
        "default_index": "log-*"
      },
      "tail_interval_in_seconds": 10,
      "es_index_time_offset_in_seconds": 0,
      "display_timezone": "local",
      "display_timestamp_format": "YYYY-MM-DDTHH:mm:ss.SSSZ",
      "max_buckets": 500,
      "default_time_range_in_days" : 0,
      "max_hosts": 100,
      "max_events_to_keep_in_viewer": 5000,
      "default_search": "",
      "fields" : {
        "mapping" : {
            "timestamp" : "cii.date",
            "hostname" : "cii.hostname",
            "program": "cii.sourceid",
            "message": "cii.message"
        },
        "message_format": "{{{cii.cref}}} | {{{cii.logid}}} | {{{cii.logtype}}} | {{{cii.message}}} | {{{cii.audience}}} | {{{cii.userlogid}}} | {{{cii.traceid}}} | {{{cii.spanid}}} | {{{cii.error.typename}}} | {{{cii.error.datetime}}} | {{{cii.error.message}}} | {{{cii.error.trace}}}",
        "keyword_suffix" : "keyword"
      },
      "color_mapping" : {
     "field": "cii.logtype",
        "mapping": {
          "FATAL": "#FF0000",
          "ERROR": "#FF9933",
          "WARN": "#FFFF66",
          "INFO": "#B5E7A0",
          "DEBUG": "#FFFFFF",
          "TRACE": "#CFE0E8"
        }
      }
    },
    {
      "es": {
        "default_index": "log-DEVELOPER-*"
      },
      "tail_interval_in_seconds": 10,
      "es_index_time_offset_in_seconds": 0,
      "display_timezone": "local",
      "display_timestamp_format": "YYYY-MM-DDTHH:mm:ss.SSSZ",
      "max_buckets": 500,
      "default_time_range_in_days" : 0,
      "max_hosts": 100,
      "max_events_to_keep_in_viewer": 5000,
      "default_search": "",
      "fields" : {
        "mapping" : {
            "timestamp" : "cii.date",
            "hostname" : "cii.hostname",
            "program": "cii.sourceid",
            "message": "cii.message"
        },
        "message_format": "{{{cii.cref}}} | {{{cii.logid}}} | {{{cii.logtype}}} | {{{cii.message}}} | {{{cii.audience}}} | {{{cii.userlogid}}} | {{{cii.traceid}}} | {{{cii.spanid}}} | {{{cii.error.typename}}} | {{{cii.error.datetime}}} | {{{cii.error.message}}} | {{{cii.error.trace}}}",
        "keyword_suffix" : "keyword"
      },
      "color_mapping" : {
     "field": "cii.logtype",
        "mapping": {
          "FATAL": "#FF0000",
          "ERROR": "#FF9933",
          "WARN": "#FFFF66",
          "INFO": "#B5E7A0",
          "DEBUG": "#FFFFFF",
          "TRACE": "#CFE0E8"
        }
      }
    }
  ]
}
9.6.4.4. Main Window
The main window is presented when the Logtrail app is accessed is composed of three main parts:
The Kibana Menu is located on the left side of the window and provides access to the different Kibana applications. On the bottom part it has a Collapse button that toggles the menu mode between icon with names and only icons.
The log filtering and navigation controls are located at the bottom of the screen. They allow a user to apply different types of filters to the logs, navigate to the logs at a specific point in time, and to enable or disable live tailing of events.
The logs viewer is the main element of the window. It provides a scrollable view of the currently browsed logs according to the format defined in the Logtrail configuration.
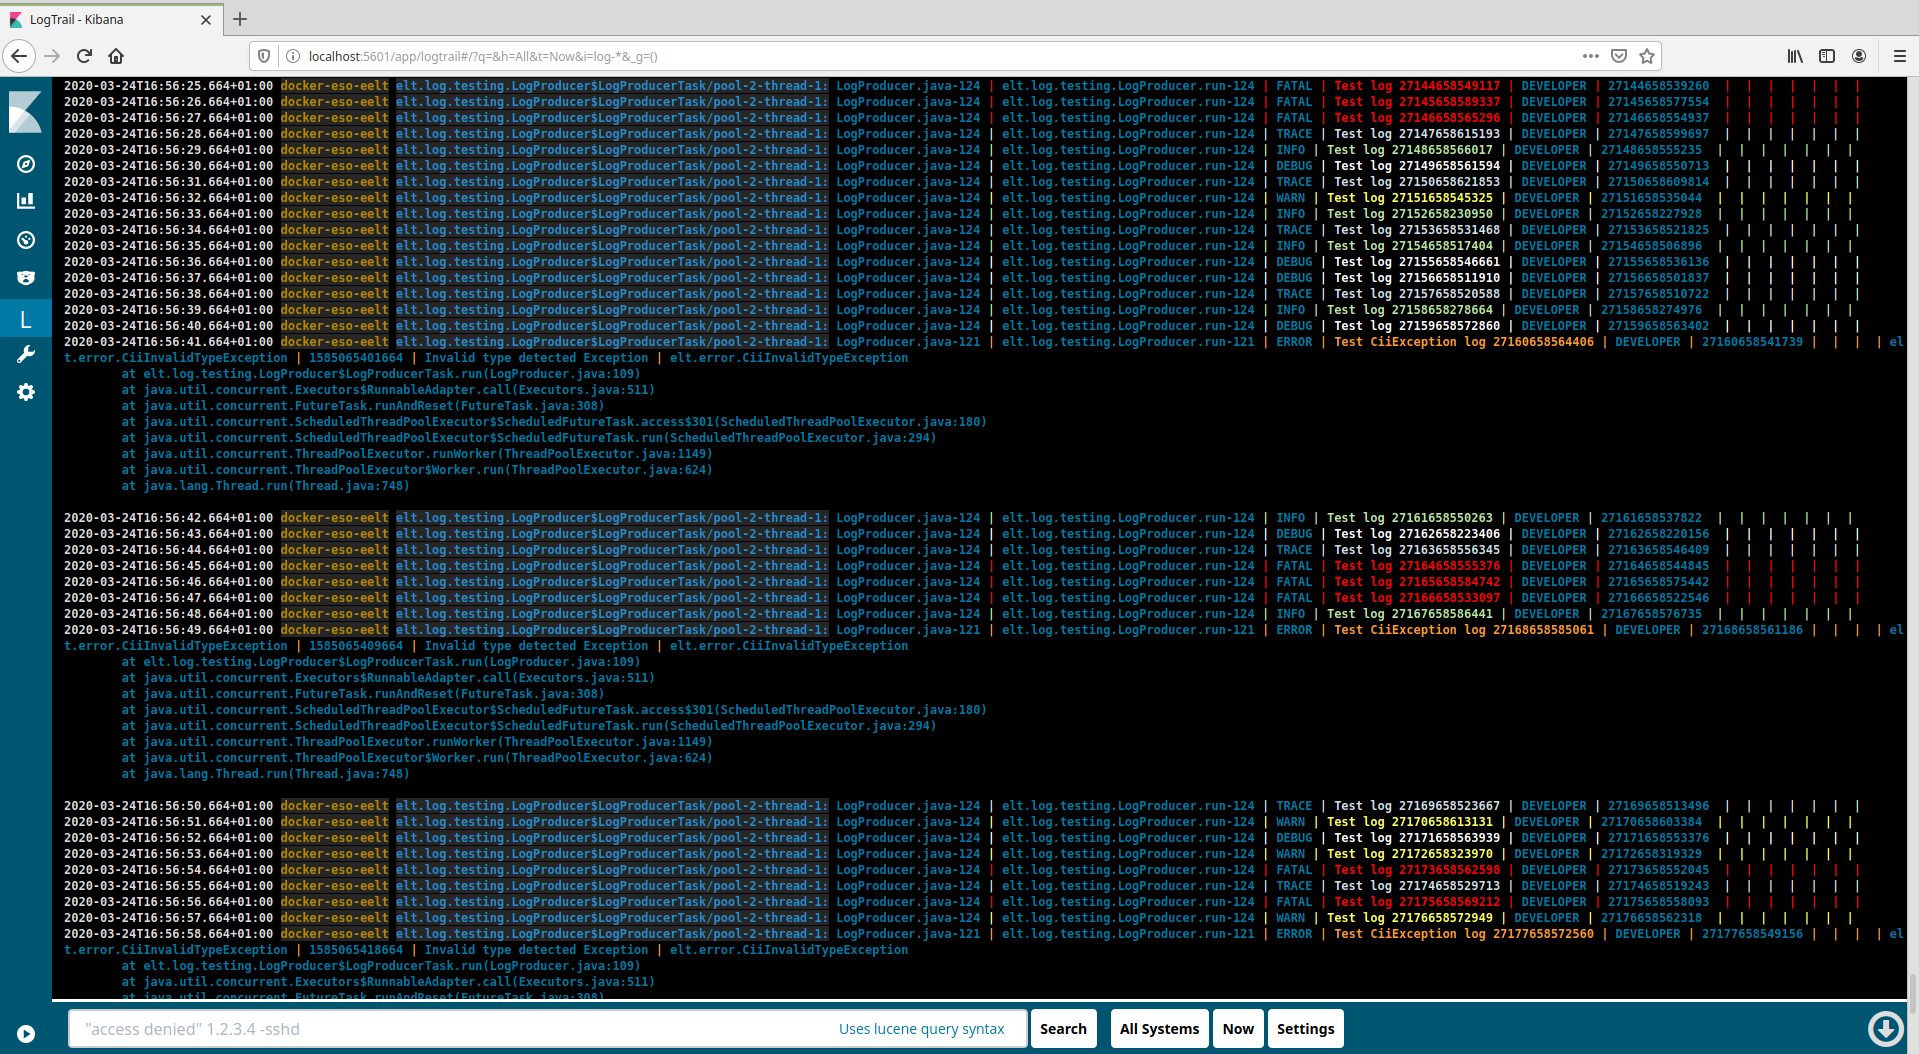
Figure 6‑9 Logtrail main window
9.6.4.4.1. Filtering logs
The first element from the left on the bottom controls is the filtering field (Figure 7‑10). It is possible to filter logs using the Lucene Query Syntax [19].

Figure 6‑10 Logtrail filtering field
For example, the following would filter logs of cii.logtype ERROR and cii.hostname including substring “elt”.
cii.logtype: "ERROR" AND cii.hostname: "*elt*"
To apply the filter, press enter, or click the Search button.
Time-range queries also support relative values. For example, the following example query will display all the log events of the last 24 hours:
cii.date:[NOW-1DAY TO NOW]
When no field name is provided it will search in the field mapped as message in the Logtrail configuration, cii.message in this case. The matched substring will be highlighted on the message field.
Clicking on one of the fields of a log event will automatically filter logs according to the value of the clicked field. For example, clicking on the cii.logtype field of a log event with value ERROR will filter the logs and display only the ones with cii.logtype value ERROR.
9.6.4.4.2. Selecting a hostname
The All Systems button is located to the right of the Search button, and when clicked it will display a popup containing a list of all the hostnames found in the current log index pattern. The number of hosts displayed is limited and can be configured with the max_hosts property in the configuration. When a hostname is selected, only the logs for that hostname will be displayed, and the button will change its label to reflect the selected hostname.
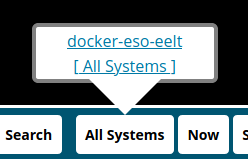
Figure 6‑11 Logtrail hostname filter
9.6.4.4.3. Navigating to a point in time
The “seek to” button can be found to the right of the hostname filtering button (Figure 7‑12). The button displays as its label the current seek to point in time, which by default is Now. When clicked, it opens a popup containing a field to enter a point in time. The user must define a point in time and click the Seek to button. When applied, Logtrail will seek to the logs at the selected point in time.
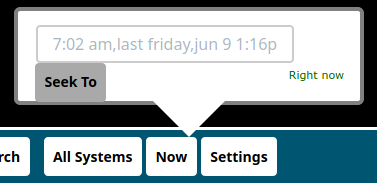
Figure 6‑12 Logtrail seek-to control
9.6.4.4.4. Selecting an index pattern
The Settings button (Figure 7‑13) is located to the right of the “seek to” control. This button allows a user to switch between the different index patterns Logtrail configurations. When clicked, it will display a dropdown menu with the list of available index pattern configurations where the desired pattern can be selected by clicking on it. Once an index pattern is selected, only logs from indices matching this pattern will be displayed.
It must be noted that the appropriate Logtrail configuration must be provided for an index pattern to be browsable with Logtrail. It is not enough to only define that index pattern in Kibana.
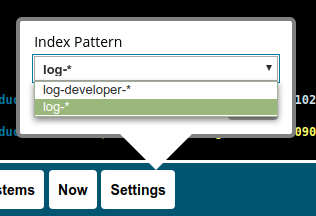
Figure 7‑13 Logtrail index pattern selection
9.6.4.4.5. Live tailing of log events
Logtrail supports live tailing of events. The refresh rate when on live tail mode is defined on the tail_interval_in_seconds property of the Logtrail configuration.
The control for live tail mode is located in the right-bottom corner of the window, and it can be on three different states, as described in Table 6‑3.
Table 6‑3 Logtrail live tail control states
Icon |
State description |
|---|---|
|
When this icon is displayed, it means that the currently displayed log events are not the latest available from the last performed search or last refresh. When clicked, Logtrail will seek to the latest available log events and start polling periodically the Elasticsearch live tailing the new results. |
|
This icon is displayed when Logtrail is in live tailing mode. When clicked it will stop the live tailing |
|
This icon means we are at the latest available log from the last search or refresh and live tailing of log events is paused. Clicking it will start the live tailing again. |


It must be noted that the Logtrail version used in the current release has a bug, which makes these live tailing control buttons not render in certain web browsers, such as Google Chrome.
9.7. Tracing
This section describes the CII Tracing system, including application instrumentation examples as well as the different services used to manage and browse the tracing data produced by the CII distributed systems.
9.7.1. Introduction
Tracing purpose is to aid developers and engineers in the understanding of interactions between components in a distributed system.
It must be noted that logging and tracing are handled separately and there is no automatic connection between logs and traces. This logical connection must be created manually by the user.
It is supported in CII with the OpenTracing API [22], and Jaeger [23] is used as the OpenTracing implementation.
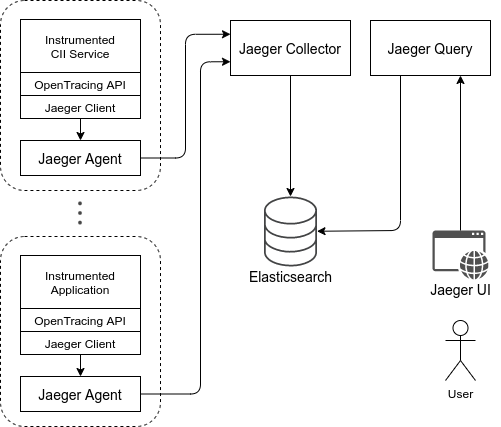
Figure 8‑1 CII Tracing architecture
The architecture of the tracing system is shown in the figure above.
It can be divided in:
Instrumented application using OpenTracing API and Jaeger Client libraries
Jaeger services
Elasticsearch persistence backend
The Jaeger services used are:
Jaeger Agent
Jaeger Collector
Jaeger Query
A standard workflow of the tracing system is also shown in Figure 8‑1.
Applications and services instrumented with the OpenTracing API produce tracing data, that is sent to a Jaeger Agent by the Jaeger Client library.
The Jaeger Agent collects tracing data from multiple applications and sends batches of data to the Jaeger Collector.
The Jaeger Collector is responsible for persisting the tracing data received from the Jaeger Agents to an Elasticsearch instance.
Finally, the Jaeger Query service provides access to the persisted tracing data, as well as the Jaeger UI, which can be used to browse the tracing data.
9.7.1.1. Traces and Spans
Distributed tracing relies on traces and spans. A trace is the complete processing of a request. The trace represents the whole execution path of a request as it moves through all of the services or components of a distributed system. All trace events generated by a request share a trace ID that tools use to organize, filter, and search for specific traces.
Each trace is comprised of several spans. A span is an activity or operation that takes place within individual services or components of the distributed system. Each span is another step in the total processing of the overall request. Spans are typically named and timed operations. Spans each carry a unique span ID, and can also carry a reference to their parent span, metadata, or other annotations.
A trace can be seen as a directed acyclic graph, where spans are the nodes and references between spans are the edges.
For example, the following figure illustrates a trace made up of 6 spans:
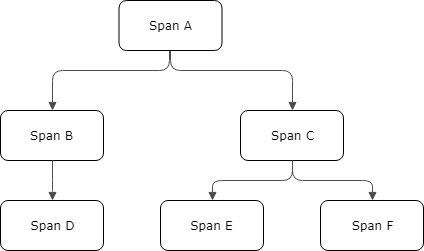
Figure 8‑2 Causal relationships between spans in a trace
While this representation allows us to visualize the relationships between the different spans in a trace, it can also be useful to visualize traces in a timeline:
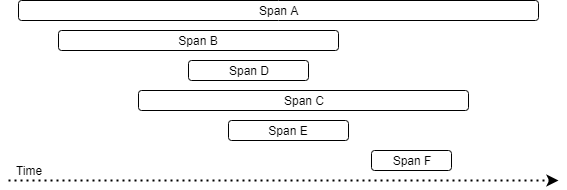
Figure 8‑3 Temporal relationships between spans in a trace
Each trace is identified by a unique Trace ID. A traced transaction that spans across multiple hosts, processes, or threads shall have a tracing context propagated between them.
This trace context must contain the following information to be able to trace the call flow of a transaction between services:
Trace ID: Identifier for a specific operation spanning across one or more distributed systems. When this operation is initiated, a Trace ID is generated and passed to other services that are called as part of the operation.
A trace is composed of one or more spans in one or more distributed hosts. Each span describes a logical unit of work, and contains the following information:
Operation name: String describing the unit of work represented by the span, e.g. ConfigService::readConfig.
Span ID: Identifies the span. It must be unique within a trace.
Parent ID: Identifier that references the ID of the span that triggered the current span.
Start time: Timestamp indicating when a span was started.
End time: Timestamp indicating when a span was ended.
The flow of this tracing context information across different services through operation can be seen in Figure 8‑4.
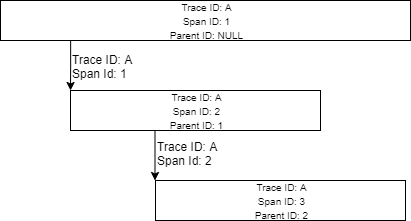
Figure 8‑4 Tracing context information flow
In this case, Service 1 would create a tracing context with Trace ID = A, Span ID = 1, and Parent ID = NULL. Together with the call to Service 2, Trace ID and Span ID of the caller are passed. Then Service 2 will create a trace context with Parent ID equal to the Span ID from Service 1 and the Trace ID to the one passed by Service 1. This newly created context will be set as the current context for Service 2. The same procedure applies to the interaction between Service 2 and Service 3 and to subsequent calls to any other service.
9.7.2. Tracing Library Usage
The following sections describe basic tracing instrumentation usage examples.
Advanced usage and configuration of the OpenTracing API and Jaeger are out of the scope of this document. For further information, see [22] and [23].
9.7.2.1. Tracing request-reply communication
Every request-reply action is instrumented.
When a new request is being issued by the client a new span is created. The MAL middleware implementation must check for existence of an active span using GlobalTracer.get().scopeManager().activeSpan() method. If there is a span active a newly created span Parent Id is set to Span Id of the active span, otherwise Parent Id is to 0. Operation name of the span is set to <instance name>::<method name>, e.g. ConfigService::readConfig. Trace Id and Span Id of the span are propagated to the server side among other request data. Upon completion or cancelation of the request the Span.finish() method is called on the created span instance.
On the server side a new span is created when request is received. The span shares the same operation name and Trace Id. It is created as a child span of the request span, i.e. Span Id of the span is set to Parent Id the of the request span. Upon completion or cancelation of the reply the Span.finish() method is called on the created span instance. The server-side implementation of a CII request-reply interface can create a child span of the span that CII created using mal tracing utilities by calling elt::mal::util::tracing::startSpan, which will create a child span of an active span if an active span exits, otherwise a childless span will be created.
9.7.2.2. Tracing publish-subscribe communication
Publish-subscribe communication is not instrumented by default. It needs to be enabled per data entity in ICD, i.e. by setting structure attribute trace to ”true”. This will instruct ICD generator to declare agnostic data entity structure as traceable by extending Traceable interface. The interface provides access to Trace Id and Span Id.
interface Traceable {
  int64_getTraceId();
  uint64 getSpanId();
};
Figure 8‑5 Definition of Traceable interface in pseudo-IDL.
On publisher side the process is the same as on the client side of request-reply communication pattern with exception that the operation name equals “publish(<data entity name>)” and the span finishes as soon as it is published (enqueued).
On the subscriber side it is programmer’s responsibility to create a new span, mal mapping will not create any spans automatically. User needs to extract a tracing context (i.e. sample->getTrace()) and create a span using mal tracing utilities. This decision has been made mostly due to the fact that multiple data entities can be read at once. The Logging API will provide helper method to create and activate a new span from received data entity that implements Traceable, e.g. TracingUtils#createSpan(methodName, traceable).
9.7.2.3. Includes/Imports
9.7.2.3.1. Java
import elt.utils.TracingUtils;
import io.opentracing.Span;
import io.opentracing.SpanContext;
import io.opentracing.Tracer;
import io.opentracing.util.GlobalTracer;
9.7.2.3.2. C++
#include <ciiTrace.hpp>
9.7.2.3.3. Python
import elt.trace
9.7.2.3.4. Java class path dependencies
To support the CII Tracing, the Opentracing and Jaeger libraries need to be added to the Java classpath. It is also important to set the Jaeger service name and sampling type and rate.
Listing 8‑1 Java tracing classpath libraries
LIBDIR="$CIISRV_ROOT/lib"
SRV_SUPPORT_LIBS="$LIBDIR/srv-support-libs/*"
JAEGER_LIBS="$LIBDIR/srv-support-libs/jaeger/*"
OPENTRACING_LIBS="$MAL_ROOT/lib/opentracing/*"
MALCOMMON_LIB="$MAL_ROOT/lib/mal-common.jar"
export JAEGER_SERVICE_NAME=tracing-example

java -DJAEGER_SAMPLER_TYPE=const -DJAEGER_SAMPLER_PARAM=1 -DJAEGER_SERVICE_NAME=$JAEGER_SERVICE_NAME -cp "$MALCOMMON_LIB:$OPENTRACING_LIBS:$JAEGER_LIBS:$SRV_SUPPORT_LIBS:$LIBDIR/*" elt.trace.examples.TracingBasicExample
9.7.2.4. Basic usage example
In these examples, tracing is initialized using the provided TracingUtils.initializeTracing() helper method, which can be used to initialize the tracing framework and register a global tracer for the current application.
Then a root span is created, and a second span with the root span as its parent.
Finally, after all spans are finished, the tracer is closed.
9.7.2.4.1. Java
This example can be run from the root directory of the logging-examples module with the run-tracing-example-java provided script. Tracing enabled examples for the request/reply and publish/subscribe are in icd-demo in directory app/java.
Listing 8‑2 Tracing basic example (Java)
/**
 * CII tracing utility usage
 */
public class TracingBasicExample {

    public static void main(String[] args) {

        /* Initialize tracing framework and register global tracer.
         */
        Tracer tracer = TracingUtils.initializeTracing();

        /* Once the global tracer is registered, it is also
         * possible to obtain an instance from GlobalTracer.
         */
        tracer = GlobalTracer.get();

        /* Start a parent span */
        Span parentSpan = tracer.buildSpan("method1")
                .start();

        /* Start a child span */
        String str;
        Span span = tracer.buildSpan("method2")
                .asChildOf(parentSpan)
                .start();

        try {
            Thread.sleep(2000);
        } catch (InterruptedException e) {
            e.printStackTrace();
        }

        /* close the child span */
        span.finish();

        try {
            Thread.sleep(3000);
        } catch (InterruptedException e) {
            e.printStackTrace();
        }

        /* close the parentSpan */
        parentSpan.finish();

        /* close global tracer */
        tracer.close();
    }
}
9.7.2.4.2. C++
This example shown in Listing 8‑3 can be run with the $CIISRV_ROOT/bin/cii-tracing-example-app executable file installed by the logging-examples module. Tracing enabled examples for a request/reply and a publish/subscribe are in icd-demo in directory app/cpp.
Listing 8‑3 Tracing basic example (C++)
int main(int ac, char *av[]) {
  try {
    /* Initialize tracing framework and register global tracer.*/
    ::elt::trace::InitializeTracing("demo-service-name");

    /* Obtain a tracer (registered in previous step) */
    std::shared_ptr<opentracing::Tracer> tracer = opentracing::Tracer::Global();
    if (!tracer) {
      throw ::elt::error::CiiException("No tracer registered");
    }

    /* Start a parent span */
    std::unique_ptr<opentracing::Span> parentSpan = tracer->StartSpan("method1");

    /* Start a child span */
    std::unique_ptr<opentracing::Span> span = opentracing::Tracer::Global()->StartSpan(
       "method2", { opentracing::ChildOf(&parentSpan->context())});
    std::this_thread::sleep_for(std::chrono::seconds(2));

    /* close the child span */
    span->Finish();
    std::this_thread::sleep_for(std::chrono::seconds(3));

    /* close the parentSpan */
    parentSpan->Finish();

    /* close global tracer */
    tracer->Close();
    return 0;
  } catch (const ::elt::error::CiiException& ex) {
    std::cerr << "CiiException occured while executing sample code. What: "
      << ex.what() << '\n';
  }
  return -1;
}
9.7.2.4.3. Python
In this example, the use of a span and the tracer as context manager is shown as well.
The example shown in Listing 8‑3 can be run with the $CIISRV_ROOT/bin/cii-tracing-example-app-py executable file installed by the logging-examples module.
Listing 8‑4 Tracing basic example (Python)
def main():
    """
    Main application code
    @return status code, int
    """
    result = 0
    try:
        # Initialize tracing framework and register global tracer
        elt.trace.initialize_tracing('demo-service-name')

        # Obtain a tracer (registered in previous step)
        tracer = elt.trace.opentracing.Tracer.get_global()
        if tracer is None:
            raise RuntimeError('No tracer registered')

        # Start a parent span
        parent_span = tracer.start_span('method 1')

        # Start a child span
        span = tracer.start_span("method2",
                      [elt.trace.opentracing.child_of(parent_span.context())])

        time.sleep(2)

        # Close the child span
        span.finish()

        # Span as context manager
        with tracer.start_span("method3",
                     [elt.trace.opentracing.child_of(parent_span.context())]):
            time.sleep(1)
        # span.finish() was called on context exit

        time.sleep(1)

        # Close the parent span
        parent_span.finish()

        # Use tracer as context manager that closes itself automatically
        with tracer:
            # make another span and use it as context manager
            with tracer.start_span('another span'):
                time.sleep(1)
        # global tracer is closed a this point
        # to explicitly close the tracer, use: tracer.close()

    except Exception as e:
        print('Exception occured while executing sample code: %s', e)
        traceback.print_exc()
        result = 5
    return result

if __name__ == '__main__':
    sys.exit(main())
9.7.2.5. Mal pub/sub and request/response tracing basic examples
Mal tracing examples are part of icd-demo project and are listed in Table 2.
Table 2: MAL tracing basic examples in icd-demo
Example type |
Example location |
|---|---|
Mal pub/sub java tracing example |
app/java/src/elt/mal/example/ps |
Mal pub/sub c++ tracing example |
app/cpp/ps/publisher/src app/cpp/ps/subscriber/src |
Mal pub/sub python tracing example |
app/python/ps/publisher/src app/python/ps/subscriber/src |
Mal request/response java tracing example |
app/java/src/elt/mal/example/rr |
Mal request/response c++ tracing example |
app/cpp/rr/client/src app/cpp/rr/server/src |
Mal request/response python tracing example |
app/python/rr/client/src app/python/rr/server/src |
Basic examples for mal pub/sub tracing (based on examples in icd-demo):
Listing 8‑5 Tracing mal pub/sub example (C++)
/**
  * @brief Initialize tracing (implementation specific to the user
  * environment, mal is using only opentracing API to obtain the tracer)
  *
  *  In this example we are using jaeger implementation of opentracing
  *  standard.
  *
  * @param service_name opentracing service name
  *
  */
void InitializeTracing(const std::string& service_name) {
  const bool log_span = true;
  const bool disabled = false;
  const double always_sample = 1.0;

  /* Configuration specific to jaeger (opentracing API implementation) */

  jaegertracing::Config config = jaegertracing::Config(
    disabled,
    jaegertracing::samplers::Config(
      CONST_SAMPLING_STRATEGY,
      always_sample),
    jaegertracing::reporters::Config(
      jaegertracing::reporters::Config::kDefaultQueueSize,
      jaegertracing::reporters::Config::defaultBufferFlushInterval(),
      log_span,
      ::jaegertracing::reporters::Config::kDefaultLocalAgentHostPort));

  std::shared_ptr<opentracing::Tracer> tracer = jaegertracing::Tracer::make(
    service_name, config, jaegertracing::logging::consoleLogger());

  /* Register jaeger tracer as global opentracing tracer,
     MAL will call opentracing API to obtain this tracer*/
  opentracing::Tracer::InitGlobal(
    std::static_pointer_cast<opentracing::Tracer>(tracer));
}


InitializeTracing("Some service");

/* Create a subscriber and a publisher in usual way and start publishing */

::elt::mal::Uri uri("zpb.ps://127.0.0.1:12404/test");
std::unique_ptr<ps::Subscriber<elt::SampleDataEntity>> subscriber =
  mal::CiiFactory::getInstance().getSubscriber<elt::SampleDataEntity>(
  uri, m_standardQoS, m_malProperties);

std::unique_ptr<ps::Publisher<elt::SampleDataEntity>> publisher =
  mal::CiiFactory::getInstance().getPublisher<elt::SampleDataEntity>(
  uri, m_standardQoS, m_malProperties);

std::shared_ptr<elt::SampleDataEntity> dataEntity = publisher->createDataEntity();

dataEntity->setText("Initial");
dataEntity->setSampleId(0);

const std::size_t  SAMPLE_COUNT = 3;
for (std::size_t i = 0; i < SAMPLE_COUNT; i++) {
  std::stringstream ss;
  ss << "Some text" << i;
  dataEntity->setText(ss.str());
  dataEntity->setSampleId(i);

 /* Since the global tracer is set (InitializeTracing) and
    elt::SampleDataEntity has struct attribute trace="true",
    MAL will start a new span and finish it immediately and propagate the span
    context using sample->setTrace()*/

  publisher->publish(*dataEntity, std::chrono::milliseconds(100));
}

std::this_thread::sleep_for(std::chrono::milliseconds(100));

std::vector<std::shared_ptr<elt::SampleDataEntity>> samples = subscriber->read(0);

std::shared_ptr<elt::SampleDataEntity> sample = samples.at(0);

/* Obtain tracer using opentracing API */
std::shared_ptr<opentracing::Tracer> tracer = opentracing::Tracer::Global();

/* Obtain the span context from sample and create a child span */
std::stringstream contextStrm(sample->getTrace());

std::unique_ptr<::opentracing::SpanContext> spanContext = ::elt::mal::util::tracing::deserializeSpan(contextStrm);

{
  std::unique_ptr<opentracing::Span> childSpan = opentracing::Tracer::Global()->StartSpan(
    "tracerPublishSubscribeTest",
    {opentracing::ChildOf(spanContext.get())});
}
Listing 8‑6 Tracing mal pub/sub example (Java)
/**
 * @brief Initialize tracing (implementation specific to the user
 * environment, mal is using only opentracing API to obtain the tracer)
 *
 *  In this example we are using jaeger implementation of opentracing
 *  standard.
 *
 * @param serviceName service name
 */
public static void initializeTracing(String serviceName) {

  /* Configuration specific to jaeger (opentracing API implementation) */
  Configuration.SamplerConfiguration samplerConfig =
  Configuration.SamplerConfiguration.fromEnv().withType("const").withParam(1);

  Configuration.ReporterConfiguration reporterConfig =
  Configuration.ReporterConfiguration.fromEnv().withLogSpans(true);

  Configuration config = new
  Configuration(serviceName).withSampler(samplerConfig).withReporter(
    reporterConfig);

  /* Register jaeger tracer as global opentracing tracer,
     MAL will call opentracing API to obtain this tracer */
  GlobalTracer.registerIfAbsent(config.getTracer());
}
initializeTracing(“some service”);

/* Create a subscriber and a publisher in usual way and start publishing */
URI uri = new URI("zpb.ps://127.0.0.1:12517/Sample");

try (Subscriber<SimpleSample> subscriber =
  CiiFactory.getInstance().getSubscriber(
    uri, QoS.DEFAULT, this.malProperties, SimpleSample.class);
  Publisher<SimpleSample> publisher =
    CiiFactory.getInstance().getPublisher(
      uri, QoS.DEFAULT, malProperties, SimpleSample.class);
) {

  SimpleSample dataEntity = publisher.createDataEntity();

  dataEntity.setValue(42.0);
  dataEntity.setDaqId(0);

  final int sampleCount = 3;
  for (int i = 0; i < sampleCount; i++) {
    dataEntity.setValue(i);
    dataEntity.setDaqId(i);

   /* Since the global tracer is set (initializeTracing) and
    SimpleSample has struct attribute trace="true",
    MAL will start a new span and finish it immediately and
    propagate the span context using sample.setTrace() */

    publisher.publish(dataEntity, 100, TimeUnit.MILLISECONDS);
  }
  /* Get published samples */
  ArrayList<SimpleSample> samples = new ArrayList<>();
  LocalDateTime now = LocalDateTime.now();
  LocalDateTime timeLimit = now.plusSeconds(10);
  while (timeLimit.isAfter(now)) {
    List<SimpleSample> readSamples = subscriber.read(0);
    samples.addAll(readSamples);

    if (samples.size() == sampleCount) {
      break;
    }

    now = LocalDateTime.now();
  }

  SimpleSample simpleSample = samples.get(0);

  /* Obtain the span context from sample and create a child span */

  Span span = TracingUtil.createSpan("SubscriberDemo",
     simpleSample.getTrace(), Tags.SPAN_KIND_CONSUMER);
9.7.2.6. Context Propagation
Tracing context is automatically propagated through MAL communication. Every request-reply action is instrumented. Upon completion or cancelation of the request, the Span.finish() method is called on the created span.
OLDB messaging automatically propagates the tracing context as well. If there is no active span at the time of call of OLDB API function, then no tracing context is transferred to the OLDB. Span.finish() method is called just before OLDB call completes but only if there was an active span. The OLDB client can obtain the span context from a data point value by calling a getTrace method which will return the context only if an active span exited at the time when write method was called. Otherwise, the context will be empty. It is then the responsibility of the client to create a child span from the context read from the data point value. For the OLDB subscriptions the user is also responsible for obtaining the span context from data point value received trough a subscription listener (NewValue call) and then creating new child spans.
In both cases, if there is an active span, the new span is created with the active span as a parent.
Any other type of tracing context propagation is the responsibility of the developer (see [22]).
9.7.3. Tracing Services
This section describes the services used by tracing. The services described below are used for collection, transmission, persistence, and querying of distributed CII traces data. They must be running and properly configured for the tracing system to work.
These services should be managed and maintained by system administrators. See the Log TRD document on how to set up the tracing services.
Documentation on configuration and deployment of these services can be found in [23].
9.7.3.1. Jaeger Agent
Network daemon that listens for spans sent over UDP, which it batches and sends to the collector.
9.7.3.2. Jaeger Collector
Receives traces from Jaeger Agents and runs them through a processing pipeline. It is responsible for persisting traces to the storage backend. It supports Elasticsearch as a storage backend.
9.7.3.3. Jaeger Query
This service retrieves traces from storage and hosts a UI to display them
9.7.4. Tracing GUI (Jaeger UI)
The Jaeger UI is a web application provided by the Jaeger Query service. It allows browsing the tracing data produced by the different CII services and applications.
By default, it’s available on port 16686.
To access it, open to the http://ciijaegerqueryhost:16686 on your browser, where ciijaegerqueryhost is the hostname of the Jaeger Query service. The Jaeger UI search page will be presented to the user, as shown in Figure 8‑6.
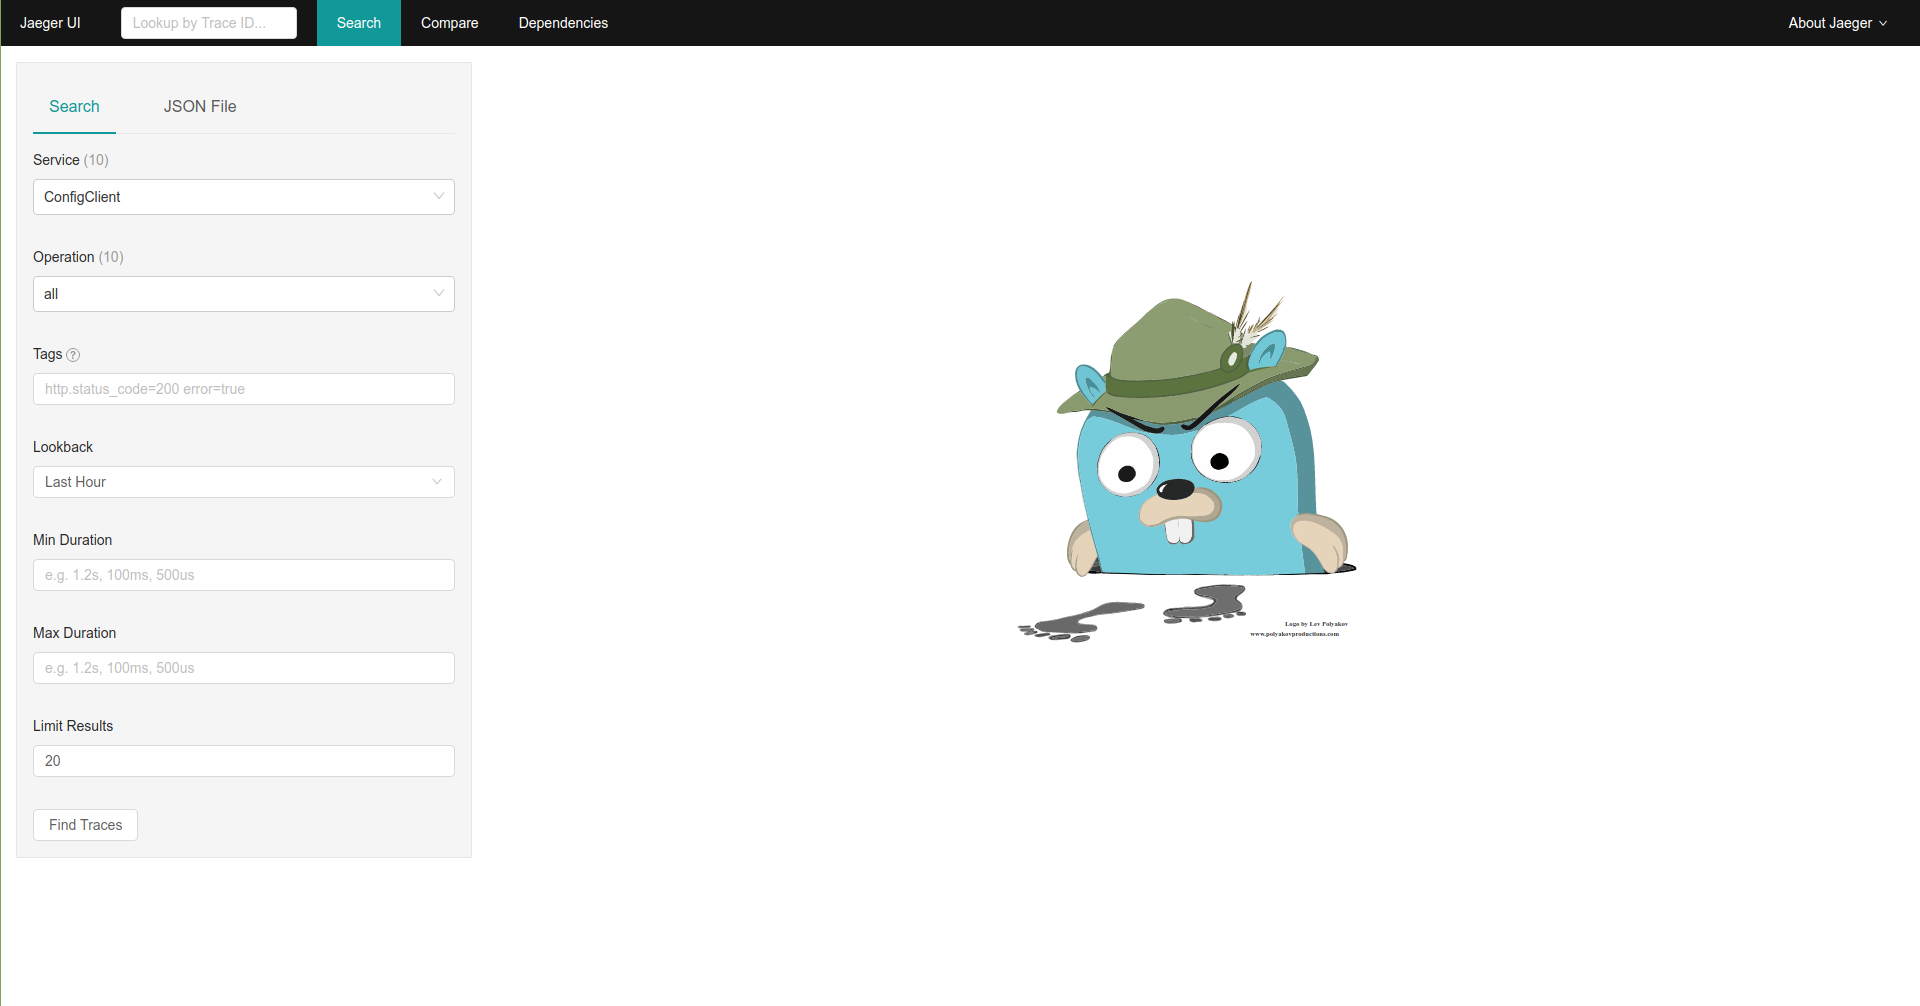
Figure 8‑6 Jaeger UI search view
On the left side of this view, the different filtering parameters for the traces search can be defined by the user. To perform the search, click the Find Traces button. When this button is clicked, a list of traces matching the search filtering options will be displayed on the right side of the screen, as shown in Figure 8‑7.
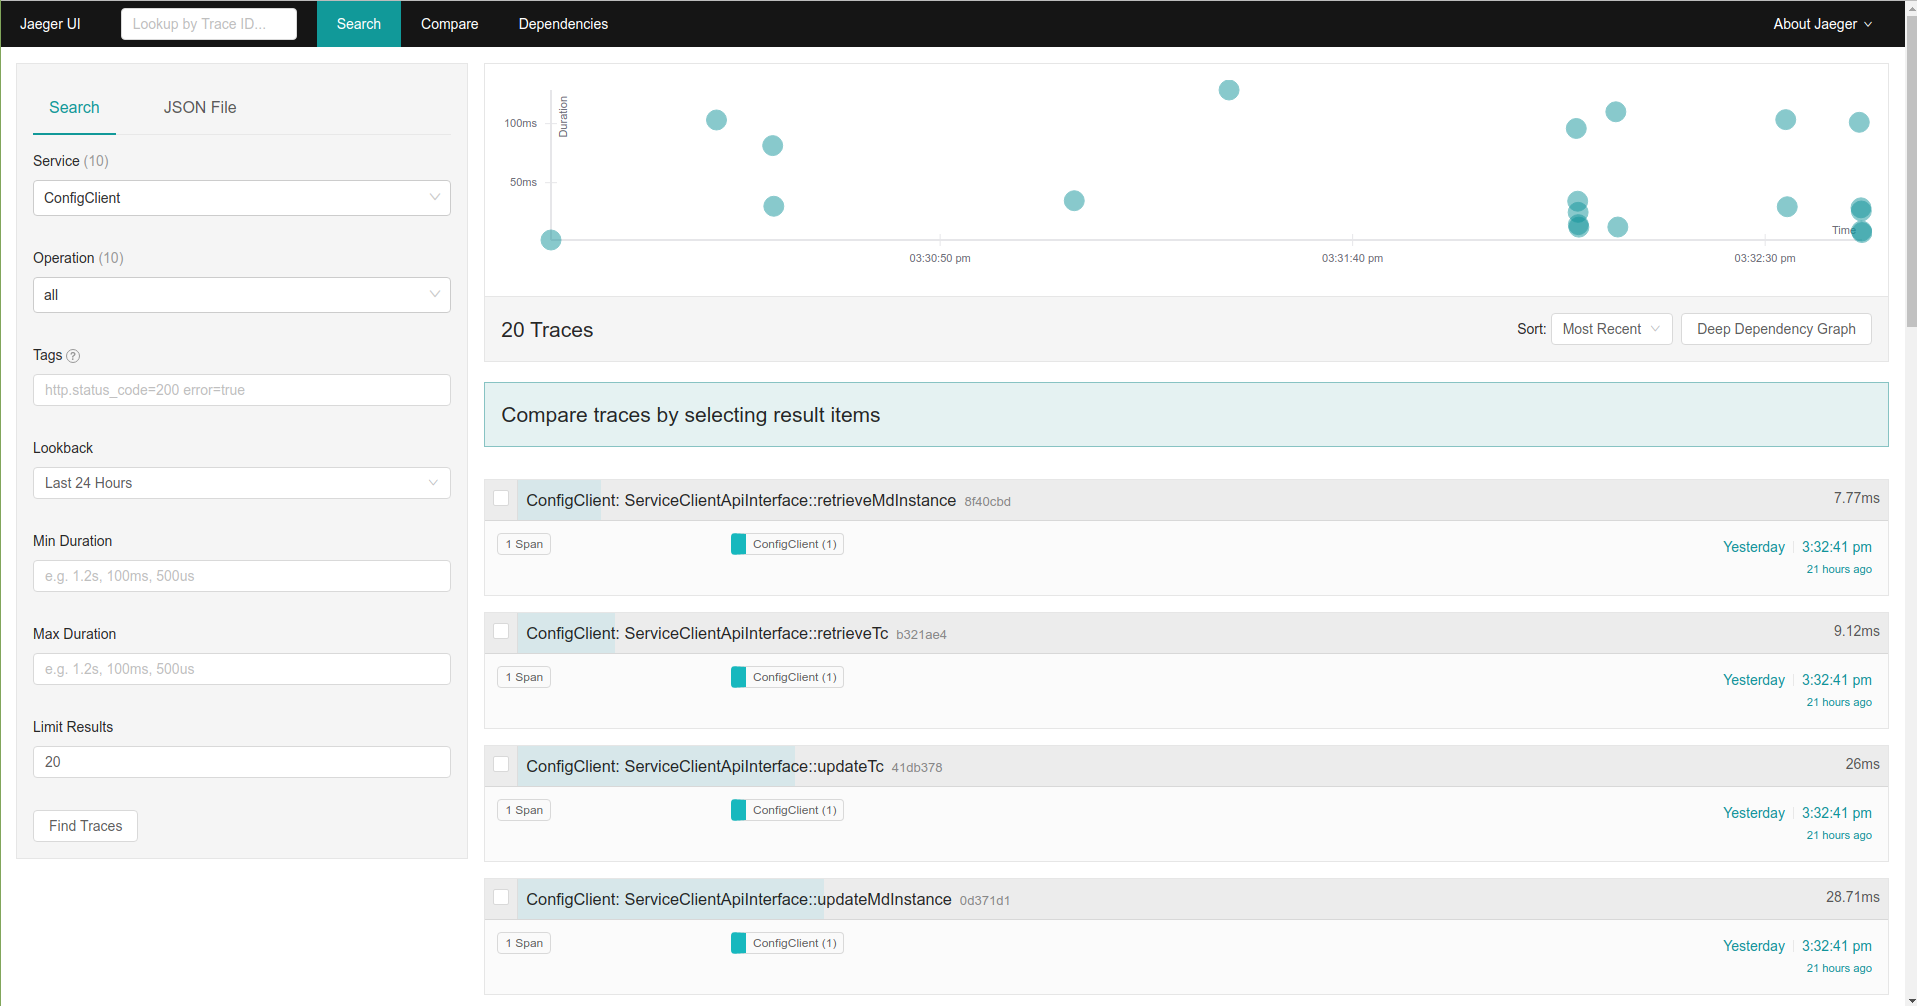
Figure 8‑7 Jaeger UI traces search result
It is possible to look for a specific trace using the Lookup by Trace ID input field on the top-left side of the screen. It is also possible to browse a trace directly with the URL https://ciijaegerqueryhost:16686/trace/<trace_id>.
When clicking on a trace on the search results list, or accessing it directly, the trace view will be presented to the user in a trace timeline view, as shown in Figure 8‑8. Clicking on each of the spans will display the information about that span.
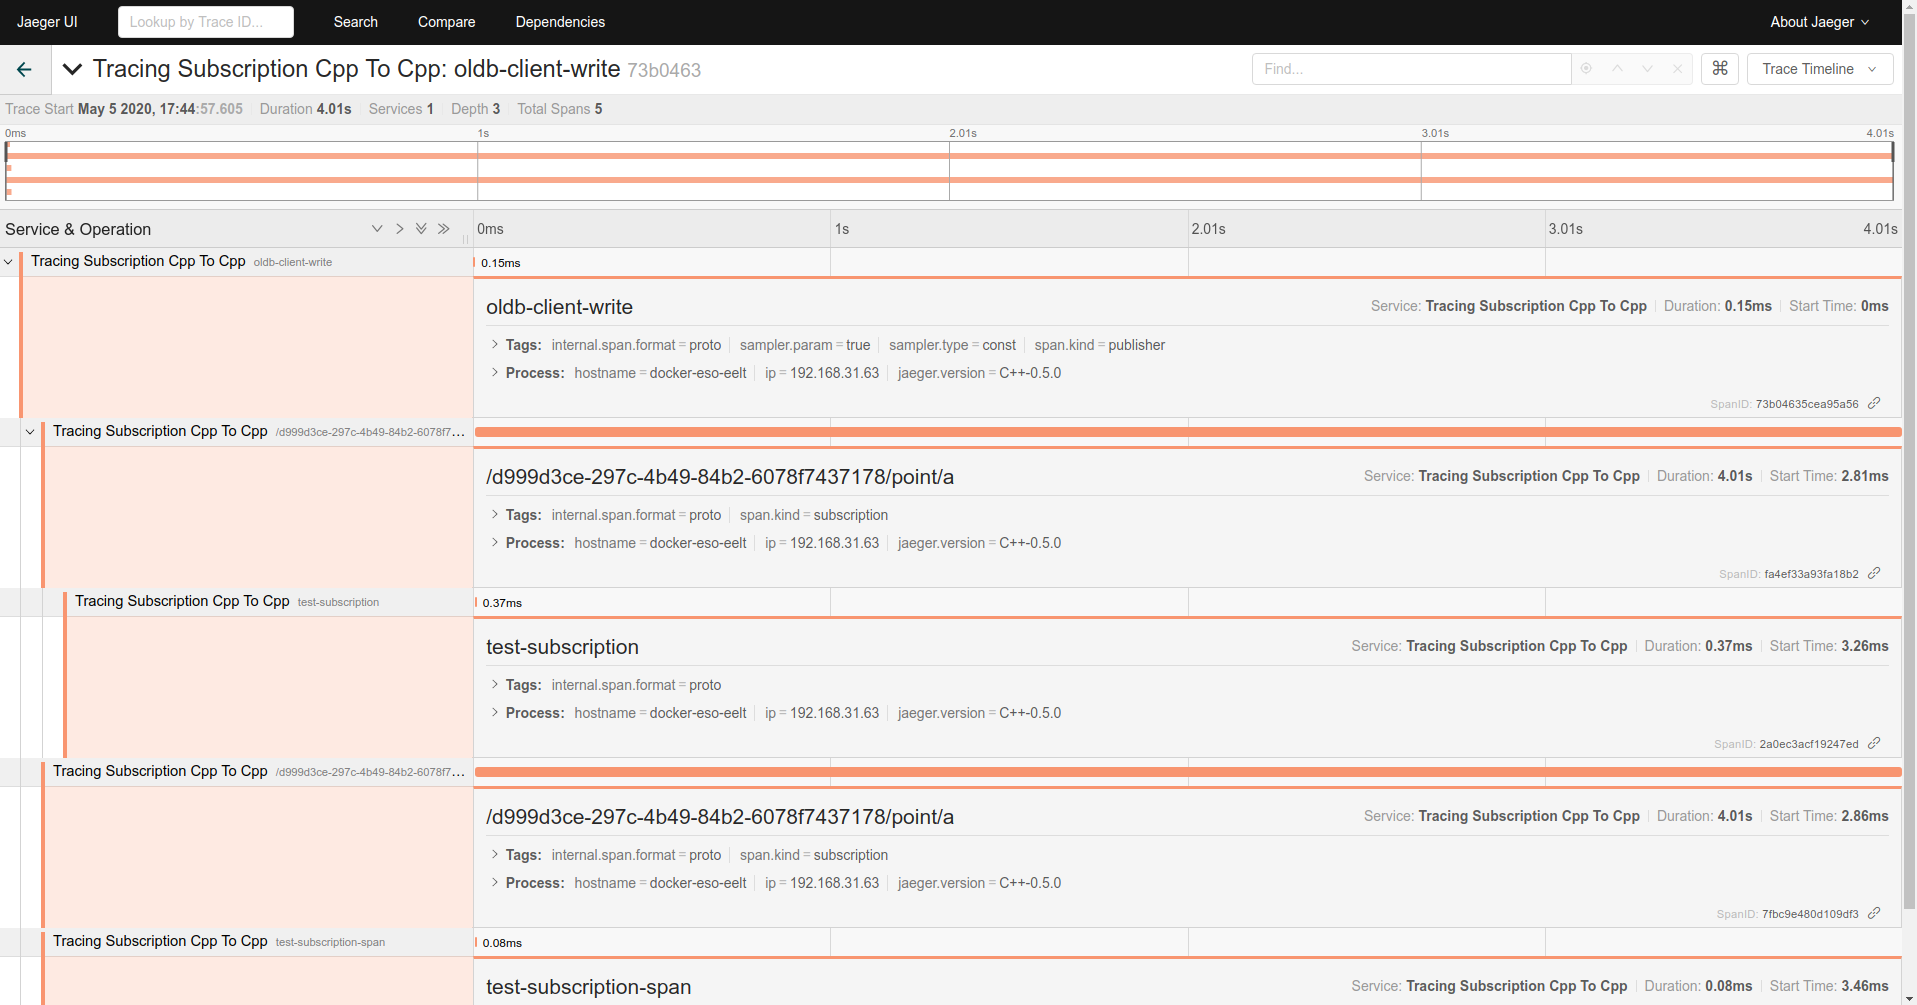
Figure 8‑8 Jaeger UI trace view
The trace view offers the following trace visualization modes:
Trace Timeline: Displays the trace and its spans in a timeline visualization (Figure 8‑8).
Trace Graph: Displays the trace and its spans as a directed acyclic graph (Figure 8‑9).
Trace JSON: Displays the trace and its spans as a JSON object.
Trace JSON (Unadjusted): Displays the trace and its spans as a JSON object with raw data without any adjustments [25].
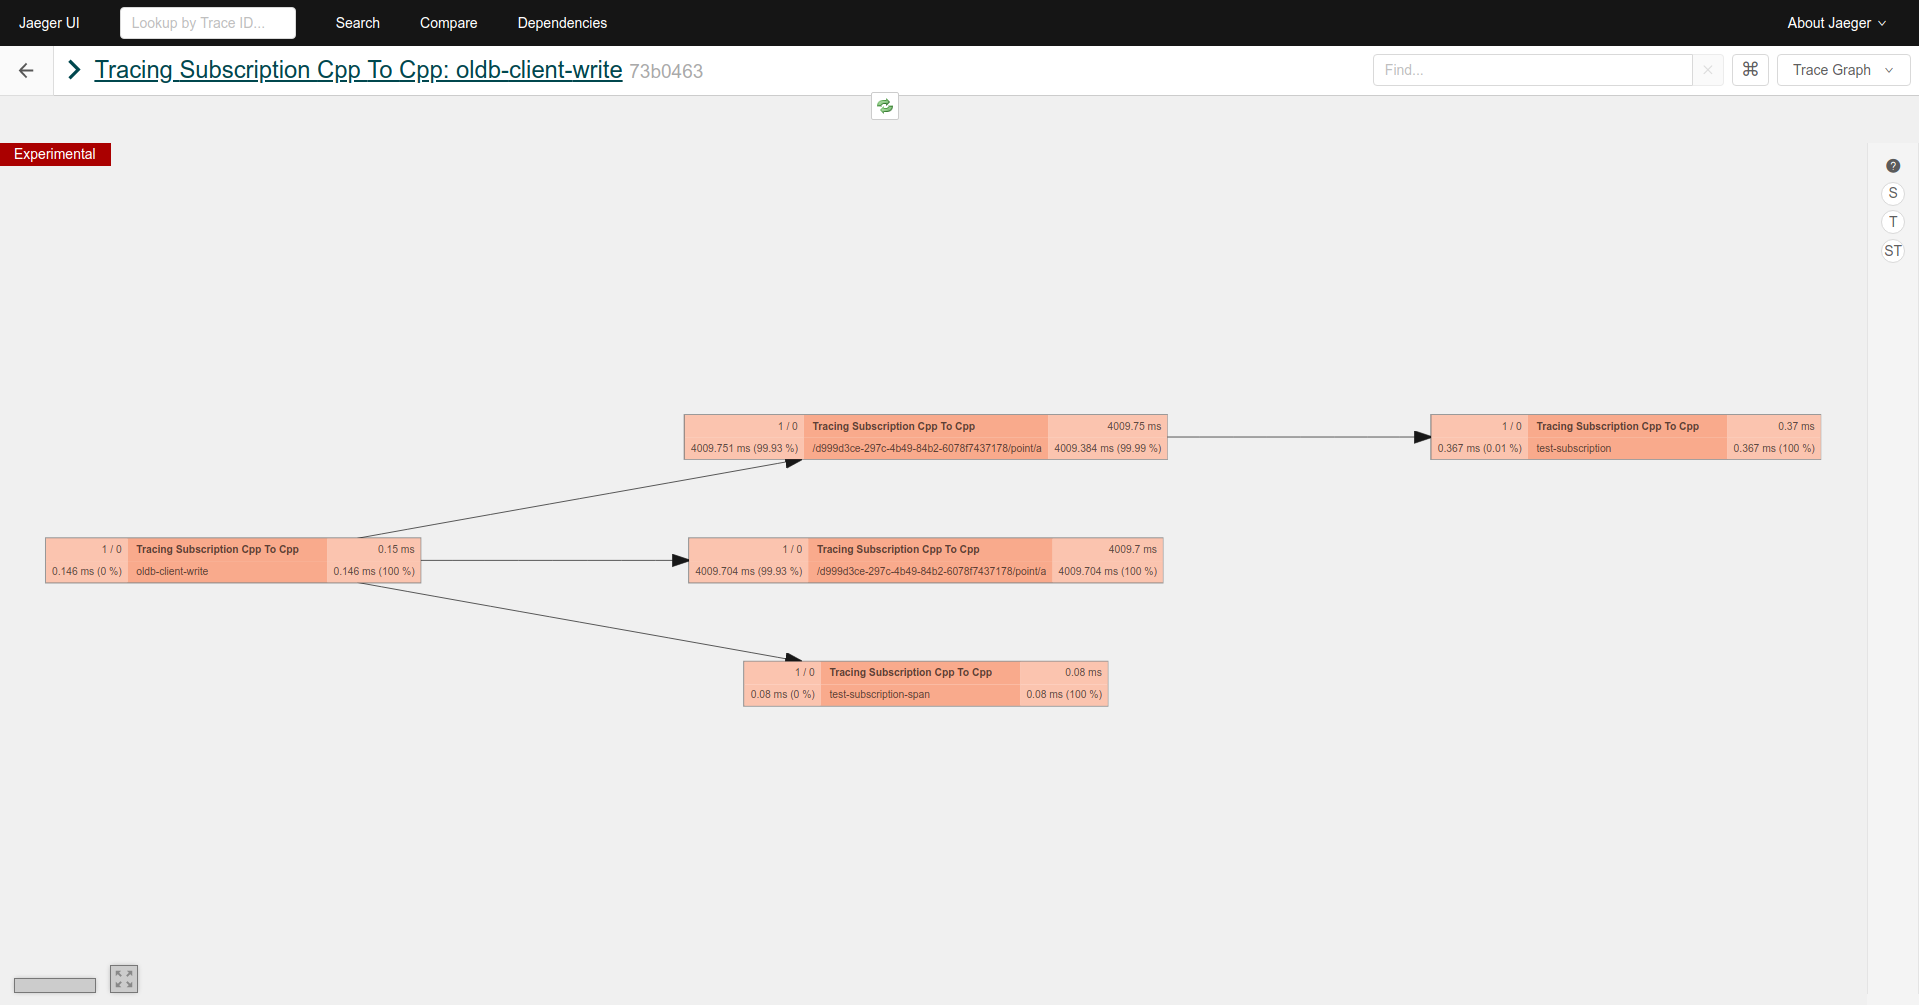
Figure 8‑9 Jaeger UI Trace Graph visualization
9.8. CII Log Client API
This are the listings for the CII Log API methods with short descriptions. APIs for Java, C++, and Python are slightly different, therefore a listing for each of the three languages is provided.
9.8.1. Java
Java CII Log API is provided by the CiiLogManager, CiiLogMessageBuilder , CiiLayout, and CiiSimpleLayout.
9.8.1.1. CiiLogManager
public static Logger getLogger() |
|---|
CII logger factory method. Returns:
|
public static Logger getLogger(String loggerName) |
|---|
CII logger factory method. Returns:
|
public static void addAppender(Appender appender, Level level, Filter filter) |
|---|
This method adds an appender with the provided level and filter to the root logger. Parameters:
|
public static void isPostmortemBufferEnabled() |
|---|
Checks if the postmortem buffer is enabled. Returns:
|
public static boolean flushPostmortemBuffer() |
|---|
Flushes buffered logs to appenders that have previously rejected those log messages. Returns:
|
public static void shutdown() |
|---|
Shuts down current logging context. |
public static long elt.log.CiiLogManager.getPostmortemBufferTtlMillis() |
|---|
Gets the value of the postmortem Time-To-Live (TTL) for buffered log events. Returns:
|
9.8.1.2. CiiLogMessageBuilder
public static CiiLogMessageBuilder create(String message) |
|---|
Factory method to create a CiiLogMessageBuilder instance with the provided Message field value. Parameters:
Returns:
|
public static CiiLogMessageBuilder create() |
|---|
Factory method to create a CiiLogMessageBuilder instance. Returns:
|
public CiiLogMessageBuilder withMessage(String message) |
|---|
Sets the Message field value. Parameters:
Returns:
|
public CiiLogMessageBuilder withUserLogId(String userLogId) |
|---|
Sets the UserLogID field value. Parameters:
Returns:
|
public CiiLogMessageBuilder withAudience(CiiLogAudience audience) |
|---|
Sets the Audience field value. Parameters:
Returns:
|
public CiiLogMessageBuilder withTracingInfo() |
|---|
Indicates the CiiLogMessageBuilder to include TraceID and SpanID fields from the current tracing context. Returns:
|
public CiiLogMessageBuilder withTracingInfo(Boolean withTracingInfo) |
|---|
Indicates the CiiLogMessageBuilder if it should include TraceID and SpanID fields from the current tracing context. Parameters:
Returns:
|
public CiiLogMessageBuilder withCiiException() |
|---|
Sets a CiiException to be formatted to the ErrorTypeName, ErrorDateTime, ErrorMessage, and ErrorTrace and added to the log message. Returns: The message builder. |
public String build() |
|---|
Constructs the log message string according to the defined parameters. Returns:
|
public static String createAndBuildWithException(String message, CiiException exception) |
|---|
Convenience method that creates a formatted log message with the the provided Message field value and the fields containing the CiiException info. Parameters:
Returns:
|
public static String createAndBuildWithAudience(String message, CiiLogAudience audience) |
|---|
Convenience method that creates a formatted log message with the the provided Message field value and the provided audience. Parameters:
Returns:
|
9.8.1.3. CiiLayout
public static CiiLayout create() |
|---|
Factory method to create a CiiLayout instance. Returns:
|
9.8.1.4. CiiSimpleLayout
public static CiiSimpleLayout create() |
|---|
Factory method to create a CiiSimpleLayout instance. Returns:
|
9.8.2. C++
C++ CII Log Client API is provided by CiiLogManager, CiiLogMessageBuilder, CiiLogConfigurator, CiiLayout, and CiiSimpleLayout classes.
9.8.2.1. CiiLogManager
void elt::log::CiiLogManager::configure ( const std::map< std::string, std::string > & properties ) |
|---|
Configure logging from properties. Parameters:
|
void elt::log::CiiLogManager::configure ( const std::string & logConfigFile ) |
|---|
Configure logging from a file name. Parameters:
|
std::string elt::log::CiiLogManager::detailMessage( const std::string & message, const CiiLogAudience audience, const std::string userLogId = “” ) |
|---|
Utility method producing a detailed message with all method’s parameters included. Parameters:
|
log4cplus::Logger elt::log::CiiLogManager::getLogger ( const std::string loggerName ) |
|---|
Gets a logger instance. Parameters:
|
9.8.2.2. CiiLogMessageBuilder
Provides a way to construct a log message according to the CII log format
elt::log::CiiLogMessageBuilder::CiiLogMessageBuilder ( ) |
|---|
Default constructor. |
elt::log::CiiLogMessageBuilder::CiiLogMessageBuilder ( const std::string & message ) |
|---|
Constructor, taking message as argument Parameters:
|
std::string elt::log::CiiLogMessageBuilder::Build ( ) const |
|---|
Build formatted log message string from information within builder and return it. Returns:
|
static CiiLogMessageBuilder elt::log::CiiLogMessageBuilder::Create ( ) |
|---|
Static method to create CiiLogMessageBuilder (Java API compat) Returns:
|
static CiiLogMessageBuilder elt::log::CiiLogMessageBuilder::Create ( const std::string & message ) |
|---|
Static method to create CiiLogMessageBuilder with message (Java API compat) Parameters:
Returns:
|
static std::string elt::log::CiiLogMessageBuilder::CreateAndBuildWithAudience ( const std::string & message, CiiLogAudience audience ) |
|---|
Static method to create a formatted log message string with provided message and audience Parameters:
Returns:
|
static std::string elt::log::CiiLogMessageBuilder::CreateAndBuildWithException ( const std::string & message, const elt::error::CiiException & exception ) |
|---|
Static method to create a formatted log message string with provided message and CiiException Parameters:
Returns:
|
static std::string elt::log::CiiLogMessageBuilder::CreateAndBuildWithMessage ( const std::string & message ) |
|---|
Static method to create a formatted log message string with provided message Parameters:
Returns:
|
CiiLogMessageBuilder& elt::log::CiiLogMessageBuilder::WithAudience ( CiiLogAudience audience ) |
|---|
Add audience to the builder and return reference to self (chaining support) Parameters
Returns
|
CiiLogMessageBuilder& elt::log::CiiLogMessageBuilder::WithException ( const elt::error::CiiException & exception ) |
|---|
Add information about an elt::error::CiiException to the builder and return reference to self (chaining support). Parameters:
Returns:
|
CiiLogMessageBuilder& elt::log::CiiLogMessageBuilder::WithException ( const std::exception & exception ) |
|---|
Add information about std::exception to the builder and return reference to self (chaining support) Parameters:
Returns:
|
CiiLogMessageBuilder& elt::log::CiiLogMessageBuilder::WithMessage ( const std::string & message ) |
|---|
Add message to the builder and return reference to self (chaining support) Parameters:
Returns:
|
CiiLogMessageBuilder& elt::log::CiiLogMessageBuilder::WithTracingInfo ( bool tracing_info ) |
|---|
Enable/disable tracing info flag and return reference to self (chaining support) Parameters:
Returns:
|
CiiLogMessageBuilder& elt::log::CiiLogMessageBuilder::WithUserLogId ( const std::string & user_log_id ) |
|---|
Add user log ID string to the builder and return reference to self (chaining support) Parameters:
Returns:
|
9.8.2.3. CiiLogConfigurator
Configures Log4cplus loggers and appenders from configuration file and injects each configured logger with one PostmortemAppender instance to keep all filtered events for some specified time for later usage.
Configure loggers with configuration from log4cplus.properties file and life time of 1 second with example:
//configure log4cplus from log4cplus.properties file and then set the
//life time of the stored events for 1 second
CiiLogConfigurator::doConfigure ( 1 , "log4cplus.properties" );
If configuration of Log4cplus is initialized without the postmortem buffer enabled, it is possible to enable it once the Log4cplus configuration has been initialized with the following method:
//set the life time of the stored events for 1 second
CiiLogConfigurator::inject( 1 );
To dump stored events which still have valid lifetimes call this method:
//dump all valid events to parent logger
CiiLogConfigurator::postmortemDump();
CiiLogConfigurator has an option to reset log4cplus configuration be fully reset when calling doConfigure:
CiiLogConfigurator::setResetOnConfigure( shouldReset );
static void elt::log::CiiLogConfigurator::doConfigure( uint32_t life_time, const log4cplus::tstring & config_filename, log4cplus::Hierarchy & h = log4cplus::Logger::getDefaultHierarchy(), unsigned flags = 0 ) |
|---|
This method eliminates the need to create a temporary PropertyConfigurator to configure log4cplus. It is equivalent to the following: PropertyConfigurator config("filename");
config.configure();
Parameters:
|
static void elt::log::CiiLogConfigurator::inject ( uint32_t life_time ) |
|---|
Inject PostMortemAppender into each configured logger instance without loading property file. Parameters:
|
static void elt::log::CiiLogConfigurator::postmortemDump ( ) |
|---|
Dump all valid events (events which have life time less than globally specified life time) to all the loggers that previously rejected them. |
static void elt::log::CiiLogConfigurator::setResetOnConfigure ( bool reset ) |
|---|
Decides whether the configuration should reset all already configured loggers when a new configuration is applied. Parameters:
|
static bool elt::log::CiiLogConfigurator::getResetOnConfigure ( ) |
|---|
Returns:
|
9.8.2.4. CiiLayout
Log layout for CII Log format.
elt::log::layout::CiiLayout::CiiLayout( const log4cplus::helpers::Properties & properties ) |
|---|
Construct CII layout with properties. Parameters:
|
9.8.2.5. CiiSimpleLayout
Simple log layout for CII Log format.
elt::log::layout::CiiSimpleLayout::CiiSimpleLayout( const log4cplus::helpers::Properties & properties ) |
|---|
Construct CII simple layout with properties. Parameters:
|
9.8.3. Python
Python CII Log Client API is provided by CiiLogManager, CiiLogConfigurator, and CiiLogMessageBuilder classes.
9.8.3.1. CiiLogManager
Provides methods to manage and configure logging, as well as methods to obtain logger objects.
log.CiiLogManager.configure(config = None) |
|---|
Perform logging configuration from provided dictionary/file just like logging.config.dictConfig() function with additional functionality:
Parameters:
Returns:
|
log.CiiLogManager.get_logger(name = None) |
|---|
CII logger factory method. Parameters:
Returns:
|
log.CiiLogManager.flush_postmortem_buffer() |
|---|
Flush buffered logs to the handlers that have previosly rejected thos log messages. Cyclic log buffer is reset. Returns:
|
log.CiiLogManager.is_postmortem_buffer_enabled() |
|---|
Query whether buffered logger is installed. Returns:
|
9.8.3.2. CiiLogConfigurator
log.CiiLogConfigurator.load_configuration(filename) |
|---|
Load log configuration from provided file. Log configuration must be saved in JSON format. Note that this is not supported with Python logging subsystem. Parsing of log configuration must produce a dictionary that is compatible with CiiLogManager.configure() method Parameters:
Returns:
|
log.CiiLogConfigurator.configure(config = None) |
|---|
Perform logging configuration from provided dictionary/file just like logging.config.dictConfig() function with additional functionality:
Parameters:
Returns:
|
log.CiiLogConfigurator.check_config( ) |
|---|
Check whether configure() method was already called. If that was not the case, it calls it to configure defaults. |
log.CiiLogConfigurator.save_configuration(config, filename) |
|---|
Save log configuration dictionary as json into provided filename. Parameters:
|
log.CiiLogConfigurator.get_formatter(simple = False) |
|---|
Create and return CII specific formatter Parameters:
Returns:
|
log.CiiLogConfigurator.flush_postmortem_buffer() |
|---|
Flush buffered logs to the handlers that have previosly rejected thos log messages. Cyclic log buffer is reset. Returns:
|
log.CiiLogConfigurator.flush_postmortem_buffer_to_string() |
|---|
Flush content of the cyclic log buffer to string. Cyclic log buffer is reset. Returns:
|
log.CiiLogConfigurator.reset_postmortem_buffer() |
|---|
Empty the log buffer if buffered logger is installed. Returns:
|
log.CiiLogConfigurator.get_effective_logsink_filename() |
|---|
Return full name of the filename for log sink (if one was created by calling get_logsink_filename). Returns:
|
log.CiiLogConfigurator.get_logsink_filename() |
|---|
Return full name of the filename for log sink. Returns:
|
log.CiiLogConfigurator.enable_postmortem_buffer(ttl_seconds = 60) |
|---|
Enable postmortem buffer by installing a buffered logger as a root logger. Parameters:
Returns:
|
log.CiiLogConfigurator.is_postmortem_buffer_enabled() |
|---|
Query whether buffered logger is installed. Returns:
|
9.8.3.3. CiiLogMessageBuilder
Provides a way to construct a log message according to the CII log format.
__init__(self, message=None) |
|---|
Constructor Parameters:
|
create(cls, message=None) |
|---|
Creates a formatted log message string with exception info. Parameters:
Returns:
|
create_and_build_with_exception(cls, message, exception) |
|---|
Creates a formatted log message string with exception info. Parameters:
Returns:
|
create_and_build_with_audience(cls, message, audience) |
|---|
Creates a formatted log message string with audience field. Parameters:
Returns:
|
create_and_build_with_args(cls, **kwargs) |
|---|
Create a formatted log message string from provided arguments. See with_args. The following arguments are supported:
Parameters:
Returns:
|
with_message(self, message) |
|---|
Sets the mesage field value. Parameters:
Returns:
|
with_user_log_id(self, user_log_id) |
|---|
Sets the user ID field value. Parameters:
Returns:
|
with_audience(self, audience) |
|---|
Sets the audience for the log message. Parameters:
Returns:
|
with_tracing_info(self, tracing_info=True) |
|---|
Sets the log message to include/exclude tracing info fields. Returns:
|
with_cii_exception(self, exception) |
|---|
Sets the exception to be formatted and included in the log message. Parameters:
Returns:
|
with_exception(self, exception) |
|---|
Sets the exception to be formatted and included in the log message. Alias for with_cii_exception. Parameters:
Returns:
|
with_args(self, message=None, audience=None, user_log_id=None, exception=None, with_tracing_info=None) |
|---|
Sets the fields from provided keyword arguments. The following arguments are supported:
Parameters:
Returns:
|
build(self) |
|---|
Construct the log message string according to the defined parameters. Returns:
|
9.9. CII Log Fields
All fields in a log message, aside from the date/time fields are treated as strings.
Table 8‑3 Log fields
Field |
ES field name |
Description |
Optional |
|---|---|---|---|
Cref |
cii.cref |
Source filename/line number. |
NO |
Date |
cii.date |
Date and time of log creation down to milliseconds in UTC timescale with the ‘T’ designator between date and time, eg: 2020-03-16T09:3 2:09.681+0100. It follows ISO 8601 standard. |
NO |
HostName |
cii.hostname |
Hostname of the computing node where the log was produced. |
NO |
LogType |
cii.logtype |
The type of log message (level). |
NO |
SourceID |
cii.sourceid |
Class name, thread name. |
NO |
LogID |
ci.logid |
ID of the log message source location. |
NO |
Message |
cii.message |
Text message of the log event. |
NO |
Audience |
cii.audience |
The intended recipient of the log. |
YES |
UserLogID |
cii.userlogid |
A user provided ID. |
YES |
TraceID |
cii.traceid |
ID of the trace for the current tracing context. |
YES |
SpanID |
cii.spanid |
ID of the span for the current tracing context. |
YES |
ErrorTypeName |
cii.error.typen ame |
Name of the CII Error |
YES |
ErrorDateTime |
cii.error.datet ime |
Unix timestamp of the error |
YES |
ErrorMessage |
cii.error.messa ge |
Message of the error |
YES |
ErrorTrace |
cii.error.trace |
Stack trace of the error |
YES |