
average
Warning(AVERAGE): no BackgndRate for OB=1, CH=11, scan= 1, Star: BSC1788Important: before beginning with the calibration, it is necessary to flag all incoherent scans since they are no longer needed. Do this using Calibrate|Visibility|FlagIncoh.
Warning(AVERAGE): no BackgndRate for OB=1, CH=11, scan= 2, Star: BSC1788
Warning(AVERAGE): no BackgndRate for OB=1, CH=11, scan= 3, Star: FKV0210
Warning(AVERAGE): no BackgndRate for OB=1, CH=11, scan= 4, Star: FKV0210
Warning(AVERAGE): no BackgndRate for OB=1, CH=11, scan= 5, Star: BSC1788
Begin calibration by displaying the plot widgets for averaged visibility data using Calibrate|Visibility|PLOT. Remember that the widget shown below on the right is created when a selection is made for the Y-axis needing further specification as to channels, baselines, etc.


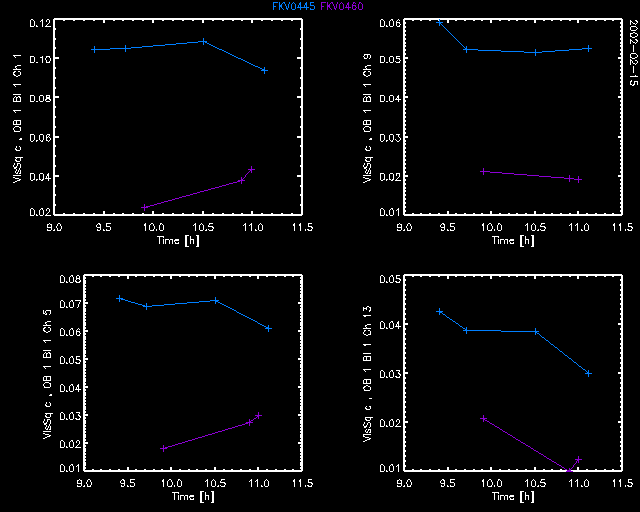
Plot this selection of visibility amplitudes on baseline 1 of both spectrometers, for the four selected channels. On spectrometer 1, baseline 1 is E02-AE0, on spectrometer 2 it is AC0-E02. Notice for the data of spectrometer 2 how the amplitude on the last scans of FKV0445/460 is much higher than compared to the other scans. This is because, by means of the point selection, we opted to plot all scans, and the two last scans were taken without the W07 station. Since this station only contributes to spectrometer 2, the visibilities of the two last scans are higher since the photons from W07, which are incoherent for the baseline under consideration, are missing.


Now plot the spectrometer 2 data with the point selection set to 111111. The resulting plot should look as shown below. Note how the amplitudes are now more consistent since they were all taken with the same configuration. For this reason, scans taken with different configurations are calibrated separately from each other.

To proceed with the calibration, display the widget using Calibrate|Visibility|CALIBRATE. Make the selection as shown below.
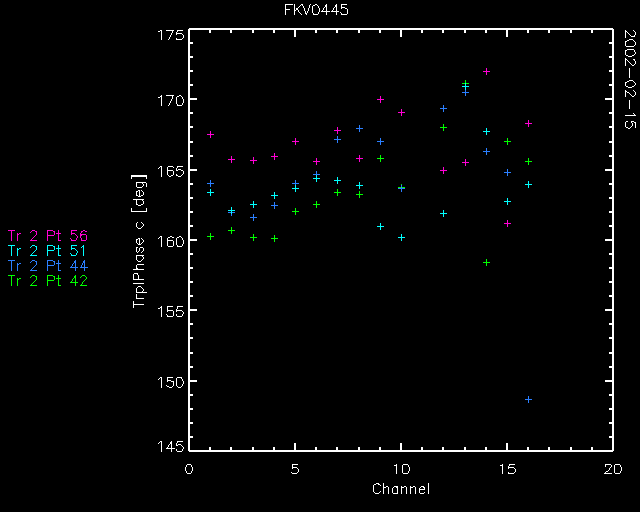
For these observations, we only need to calibrate the following triples: 2, 6, 7, and 8. Select TriplePhase in the calibration widget, and plot, just for the calibrator (FKV0445) TriplePhaseC (triple 2) versus channel, with the slice set to ch, and the All-in-one option turned on. This is how the plot should look like.

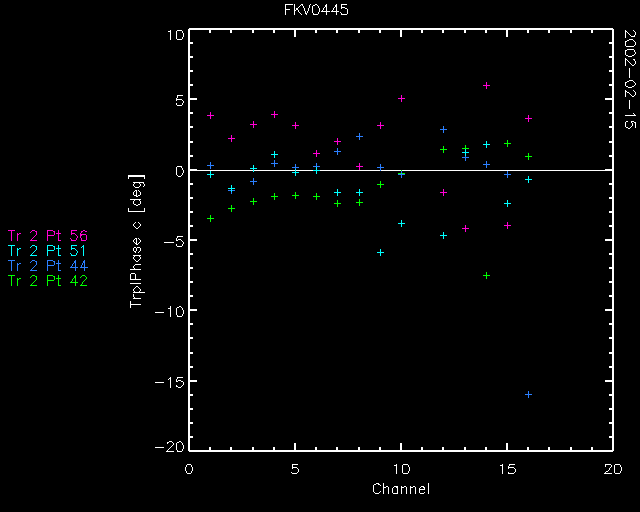
Now add FKV0460 (important!) to the star selection in the plot widget, and click on Calibrate. If you replot the data just for FKV0445, it should look like this.
