NOTE: The Health Check and calChecker services are moved to qcFlow on an instrument by instrument basis. The current pages will not be updated any longer once the move has been finished.
*Data sources: QC1DB: QC1 database; LOCAL: local data source
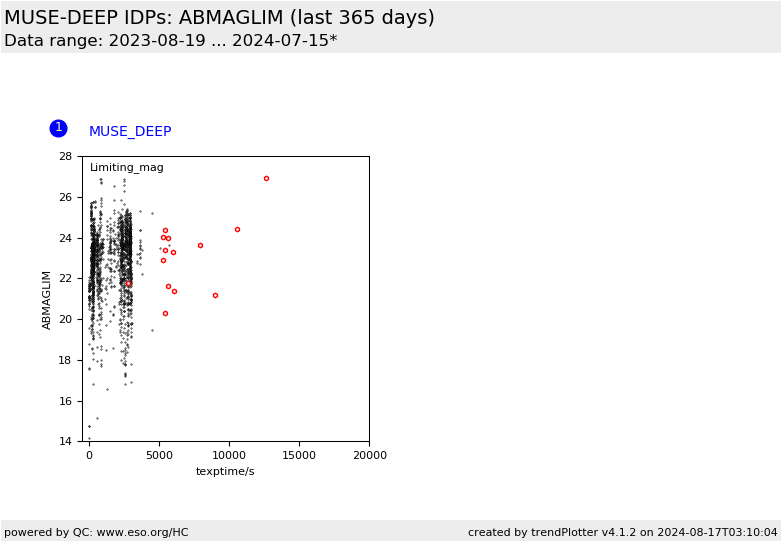
Plot 1
data source:
muse_sci_combined (QC1 database)
dataset: (numbers below apply to this dataset)
ABMAGLIM
.
average:
none
thresholds:
none
N_data plotted:
2486
[click plot for closeup]
This plot
This plot shows the relation between ABMAGLIM and the total exposure time for the MUSE-DEEP datacube IDPs. The parameter
ABMAGLIM is defined by the data products standard as limiting magnitude of the background and is essentially measuring the
background noise.
We display values for the
DEEP datacubes (combined across OBs), and for comparison also all values from the MUSE OB-based datacubes. In general, the DEEP datacubes have a higher limiting
magnitude than the OB-based datacubes (also shown as black dots, and in more detail here).
General information
Click on any of the plots to see a close-up version.
The latest date is indicated on top of the plot.
If configured,
data points belonging to the latest date are specially marked
statistical averages are indicated by a solid line, and thresholds by broken lines
outliers are marked by a red asterisk. They are defined as data points outside the
threshold lines
"aliens" (= data points outside the plot Y limits) are marked by a red arrow (↑ or ↓)
you can download the data for each parameter set if the 'Data downloads' link shows up
