Plot
? |
Symb
? |
Source
* |
Average ? |
Thresholds ? |
N_
data |
QC1
parameter |
Data
downloads |
Remarks |
| method |
value |
unit |
method |
value |
| 1 |
• | QC1DB |
MEDIAN |
36004.7 |
ADU |
VAL | 1000,55000 |
15 |
qc_rawmed_zero_odd |
this |
last_yr |
all
|
median for phase = zero, cycle = odd |
| 2 |
• | QC1DB |
MEDIAN |
848.584 |
ADU |
VAL | 200,10000 |
15 |
qc_SNR_zero_odd |
this |
last_yr |
all
|
median for phase = pi, cycle = odd |
| 3 |
• | QC1DB |
MEDIAN |
33170.3 |
ADU |
VAL | 1000,55000 |
15 |
qc_rawmed_pi_odd |
this |
last_yr |
all
|
S/N for phase = zero, cycle = odd |
| 4 |
• | QC1DB |
MEDIAN |
814.497 |
ADU |
VAL | 200,10000 |
15 |
qc_SNR_pi_odd |
this |
last_yr |
all
|
S/N for phase = pi, cycle = odd |
| 5 |
• | QC1DB |
MEDIAN |
0.04845 |
ADU |
VAL | 0.02,0.08 |
15 |
qc_rms_zero_odd |
this |
last_yr |
all
|
rms for phase = zero, cycle = odd |
| 6 |
• | QC1DB |
MEDIAN |
35829 |
ADU |
none | |
15 |
qc_plane_med |
this |
last_yr |
all
|
med or rms of plane medians of raw frame cube |
| 7 |
• | QC1DB |
MEDIAN |
0.048164 |
ADU |
VAL | 0.02,0.08 |
15 |
qc_rms_pi_odd |
this |
last_yr |
all
|
rms for phase = pi, cycle = odd |
| 8 |
• | QC1DB |
MEDIAN |
0.073303 |
ADU |
VAL | 0,0.08 |
15 |
qc_plane_rms |
this |
last_yr |
all
|
med or rms of plane medians of raw frame cube |
| |
|
*Data sources: QC1DB: QC1 database; LOCAL: local data source
|
Plot 1
scores: not implemented
| | data source: | sphere_zimpol_iflat_pol
(QC1 database) |
| dataset: | qc_rawmed_zero_odd | • |
| median: | 36004.7 | ADU |
| fixed thresholds: | 1000...55000 | ADU |
| N_data plotted: | 15 |
| [click on plot for closeup] |
Plot 2
scores: not implemented
| | data source: | sphere_zimpol_iflat_pol
(QC1 database) |
| dataset: | qc_SNR_zero_odd | • |
| median: | 848.584 | ADU |
| fixed thresholds: | 200...10000 | ADU |
| N_data plotted: | 15 |
| [click on plot for closeup] |
Plot 3
scores: not implemented
| | data source: | sphere_zimpol_iflat_pol
(QC1 database) |
| dataset: | qc_rawmed_pi_odd | • |
| median: | 33170.3 | ADU |
| fixed thresholds: | 1000...55000 | ADU |
| N_data plotted: | 15 |
| [click on plot for closeup] |
Plot 4
scores: not implemented
| | data source: | sphere_zimpol_iflat_pol
(QC1 database) |
| dataset: | qc_SNR_pi_odd | • |
| median: | 814.497 | ADU |
| fixed thresholds: | 200...10000 | ADU |
| N_data plotted: | 15 |
| [click on plot for closeup] |
Plot 5
scores: not implemented
| | data source: | sphere_zimpol_iflat_pol
(QC1 database) |
| dataset: | qc_rms_zero_odd | • |
| median: | 0.04845 | ADU |
| fixed thresholds: | 0.02...0.08 | ADU |
| N_data plotted: | 15 |
| [click on plot for closeup] |
Plot 6
scores: not implemented
| | data source: | sphere_zimpol_iflat_pol
(QC1 database) |
| dataset: | qc_plane_med | • |
| median: | 35829 | ADU |
| thresholds: | none | |
| N_data plotted: | 15 |
| [click on plot for closeup] |
Plot 7
scores: not implemented
| | data source: | sphere_zimpol_iflat_pol
(QC1 database) |
| dataset: | qc_rms_pi_odd | • |
| median: | 0.048164 | ADU |
| fixed thresholds: | 0.02...0.08 | ADU |
| N_data plotted: | 15 |
| [click on plot for closeup] |
Plot 8
scores: not implemented
| | data source: | sphere_zimpol_iflat_pol
(QC1 database) |
| dataset: | qc_plane_rms | • |
| median: | 0.073303 | ADU |
| fixed thresholds: | 0...0.08 | ADU |
| N_data plotted: | 15 |
| [click on plot for closeup] |
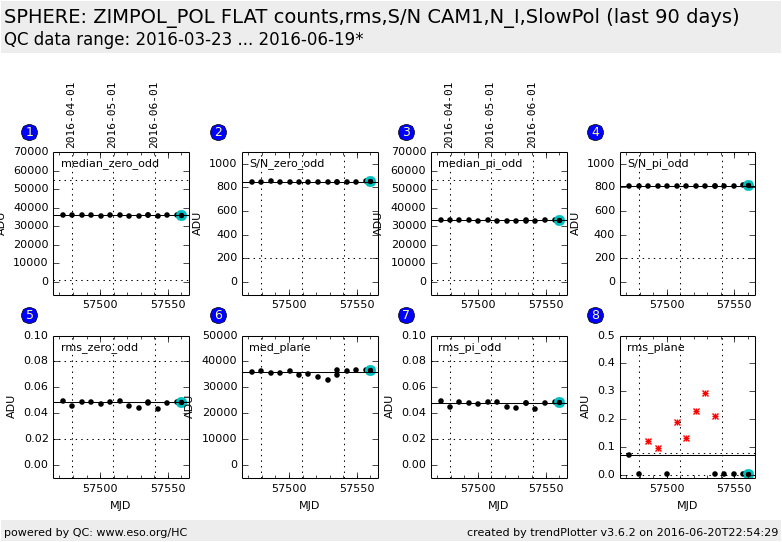
This plot shows for the given setup:
- filter = V or N_R or N_I
- channel = CAM1 or CAM2
- readmode = SlowPolarimetry or FastPolarimetry
- in Box1: The counts in the raw flatfield frame. If NDIT>1, the raw frame becomes a datacube with NAXIS3 = NDIT.
In this case the plot value correspond to the median counts in a layer of the cube.
Values are given for polarimetric phase zero and for odd sequence number.
- in Box2: signal-to-noise ratio S/N = sqrt ( NDIT * (flatcounts - biascounts)),
where flatcounts are the values from Box 1 and a fixed biascounts value of 990 is used.
- in Box3: The same values as in Box 1 but for
polarimetric phase pi and odd sequence number.
- in Box4 the same values as in Box2 but for polarimetric phase pi and odd sequence number.
- in Box5: The rms of the raw flatfield frame, corresponding to the same
data source as Box1.
- in Box6: The median of the raw frame cube plane medians.
- in Box7: The rms of the raw flatfield frame, corresponding to the same
data source as Box3.
- in Box8: The rms of the raw frame cube plane medians.
General information
Click on any of the plots to see a close-up version.
The latest date is indicated on top of the plot.
If configured,
- data points belonging to the latest date are specially marked
- statistical averages are indicated by a solid line, and thresholds by broken lines
- outliers are marked by a red asterisk. They are defined as data points outside the
threshold lines
- "aliens" (= data points outside the plot Y limits) are marked by a red arrow (↑ or ↓)
- you can download the data for each parameter set if the 'Data downloads' link shows up
|
