Plot
? |
Symb
? |
Source
* |
Average ? |
Thresholds ? |
N_
data |
QC1
parameter |
Data
downloads |
Remarks |
| method |
value |
unit |
method |
value |
| 1 |
• | QC1DB |
MEDIAN |
290083 |
number |
VAL | 200000,400000 |
16 |
qc_num_badpix |
this |
last_yr |
all
|
Y-band beam |
| 2 |
• | QC1DB |
MEDIAN |
293486 |
number |
VAL | 200000,400000 |
16 |
qc_num_badpix |
this |
last_yr |
all
|
J-band beam |
| 3 |
• | QC1DB |
MEDIAN |
292035 |
number |
VAL | 200000,400000 |
29 |
qc_num_badpix |
this |
last_yr |
all
|
H-band beam |
| 4 |
• | QC1DB |
MEDIAN |
305905 |
number |
VAL | 200000,400000 |
17 |
qc_num_badpix |
this |
last_yr |
all
|
K-band beam |
| |
|
*Data sources: QC1DB: QC1 database; LOCAL: local data source
|
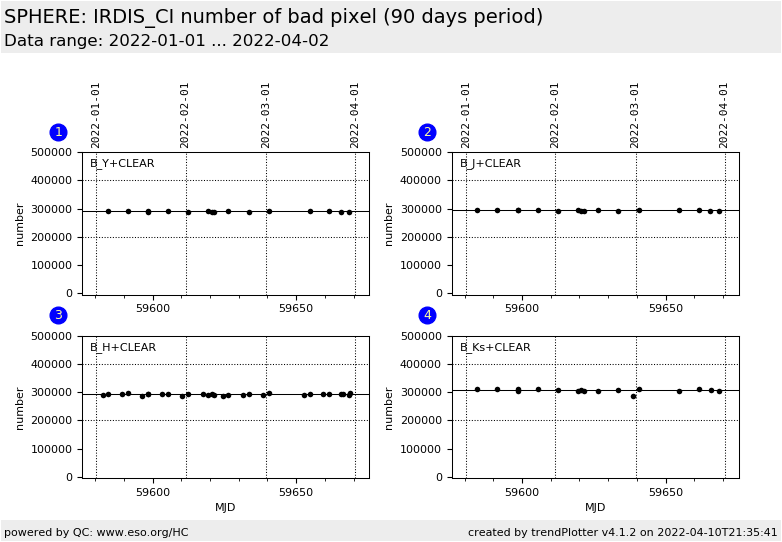
| Plot 1 | | data source: | sphere_irdis_flat
(QC1 database) |
| dataset: | qc_num_badpix | • |
| median: | 290083 | number |
| fixed thresholds: | 200000...400000 | number |
| N_data plotted: | 16 |
| [click plot for closeup] |
| Plot 2 | | data source: | sphere_irdis_flat
(QC1 database) |
| dataset: | qc_num_badpix | • |
| median: | 293486 | number |
| fixed thresholds: | 200000...400000 | number |
| N_data plotted: | 16 |
| [click plot for closeup] |
| Plot 3 | | data source: | sphere_irdis_flat
(QC1 database) |
| dataset: | qc_num_badpix | • |
| median: | 292035 | number |
| fixed thresholds: | 200000...400000 | number |
| N_data plotted: | 29 |
| [click plot for closeup] |
| Plot 4 | | data source: | sphere_irdis_flat
(QC1 database) |
| dataset: | qc_num_badpix | • |
| median: | 305905 | number |
| fixed thresholds: | 200000...400000 | number |
| N_data plotted: | 17 |
| [click plot for closeup] |
This plots shows the number of bad pixel as derived from the flats recipe
of the whole read out detector (both beams).
The values are currently not scored.
If turned out not significant, the handling of this QC parameter is subject of
modifications.
General information
Click on any of the plots to see a close-up version.
The latest date is indicated on top of the plot.
If configured,
- data points belonging to the latest date are specially marked
- statistical averages are indicated by a solid line, and thresholds by broken lines
- outliers are marked by a red asterisk. They are defined as data points outside the
threshold lines
- "aliens" (= data points outside the plot Y limits) are marked by a red arrow (↑ or ↓)
- you can download the data for each parameter set if the 'Data downloads' link shows up
|
