|
|
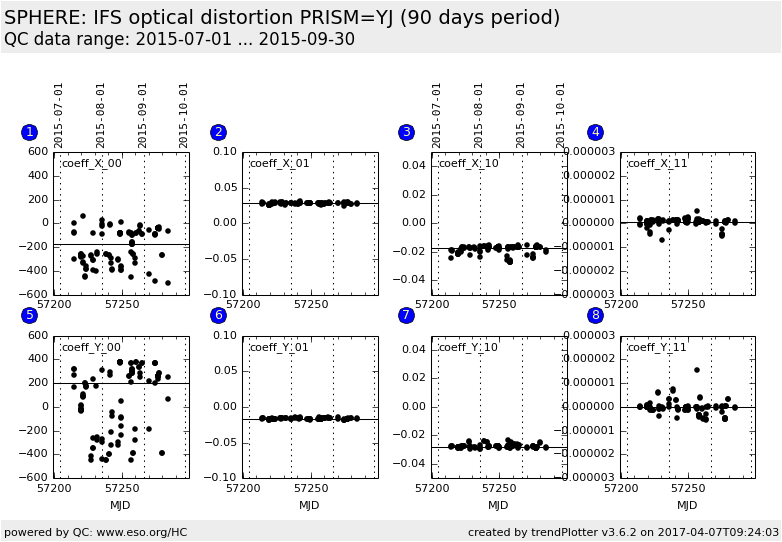
| SPHERE trending system: HISTORY report |
|
|
|
Last update: 2017-04-07T09:24:09 (UT)
|
|
|
|
|
*Date on this monitor changes at 21:00 UT |
|

|
|
|
Plot
? |
Symb
? |
Source
* |
Average ? |
Thresholds ? |
N_
data |
QC1
parameter |
Data
downloads |
Remarks |
| method |
value |
unit |
method |
value |
| 1 |
• | QC1DB |
MEDIAN |
-169.865 |
NONE |
none | |
109 |
coeff_x_0_0 |
this |
last_yr |
all
|
opt. dist. pol. coeff. |
| 2 |
• | QC1DB |
MEDIAN |
0.0287039 |
NONE |
none | |
109 |
coeff_x_0_1 |
this |
last_yr |
all
|
opt. dist. pol. coeff. |
| 3 |
• | QC1DB |
MEDIAN |
-0.0168853 |
NONE |
none | |
109 |
coeff_x_1_0 |
this |
last_yr |
all
|
opt. dist. pol. coeff. |
| 4 |
• | QC1DB |
MEDIAN |
6.84763e-08 |
NONE |
none | |
109 |
coeff_x_1_1 |
this |
last_yr |
all
|
opt. dist. pol. coeff. |
| 5 |
• | QC1DB |
MEDIAN |
203.276 |
NONE |
none | |
109 |
coeff_y_0_0 |
this |
last_yr |
all
|
opt. dist. pol. coeff. |
| 6 |
• | QC1DB |
MEDIAN |
-0.0167126 |
NONE |
none | |
109 |
coeff_y_0_1 |
this |
last_yr |
all
|
opt. dist. pol. coeff. |
| 7 |
• | QC1DB |
MEDIAN |
-0.0278329 |
NONE |
none | |
109 |
coeff_y_1_0 |
this |
last_yr |
all
|
opt. dist. pol. coeff. |
| 8 |
• | QC1DB |
MEDIAN |
-2.23366e-08 |
NONE |
none | |
109 |
coeff_y_1_1 |
this |
last_yr |
all
|
opt. dist. pol. coeff. |
| |
|
*Data sources: QC1DB: QC1 database; LOCAL: local data source
|
| Plot 1 | | data source: | sphere_ifs_distmap
(QC1 database) |
| dataset: | coeff_x_0_0 | • |
| median: | -169.865 | NONE |
| thresholds: | none | |
| N_data plotted: | 109 |
| [click on plot for closeup] |
| Plot 2 | | data source: | sphere_ifs_distmap
(QC1 database) |
| dataset: | coeff_x_0_1 | • |
| median: | 0.0287039 | NONE |
| thresholds: | none | |
| N_data plotted: | 109 |
| [click on plot for closeup] |
| Plot 3 | | data source: | sphere_ifs_distmap
(QC1 database) |
| dataset: | coeff_x_1_0 | • |
| median: | -0.0168853 | NONE |
| thresholds: | none | |
| N_data plotted: | 109 |
| [click on plot for closeup] |
| Plot 4 | | data source: | sphere_ifs_distmap
(QC1 database) |
| dataset: | coeff_x_1_1 | • |
| median: | 6.84763e-08 | NONE |
| thresholds: | none | |
| N_data plotted: | 109 |
| [click on plot for closeup] |
| Plot 5 | | data source: | sphere_ifs_distmap
(QC1 database) |
| dataset: | coeff_y_0_0 | • |
| median: | 203.276 | NONE |
| thresholds: | none | |
| N_data plotted: | 109 |
| [click on plot for closeup] |
| Plot 6 | | data source: | sphere_ifs_distmap
(QC1 database) |
| dataset: | coeff_y_0_1 | • |
| median: | -0.0167126 | NONE |
| thresholds: | none | |
| N_data plotted: | 109 |
| [click on plot for closeup] |
| Plot 7 | | data source: | sphere_ifs_distmap
(QC1 database) |
| dataset: | coeff_y_1_0 | • |
| median: | -0.0278329 | NONE |
| thresholds: | none | |
| N_data plotted: | 109 |
| [click on plot for closeup] |
| Plot 8 | | data source: | sphere_ifs_distmap
(QC1 database) |
| dataset: | coeff_y_1_1 | • |
| median: | -2.23366e-08 | NONE |
| thresholds: | none | |
| N_data plotted: | 109 |
| [click on plot for closeup] |
2015-09-20: This plot is no longer supported, since the pipeline recipe
is not commissioned and QC parameters are have not been verified.
The plot might be re-activated in the future.
General information
Click on any of the plots to see a close-up version.
The latest date is indicated on top of the plot.
If configured,
- data points belonging to the latest date are specially marked
- statistical averages are indicated by a solid line, and thresholds by broken lines
- outliers are marked by a red asterisk. They are defined as data points outside the
threshold lines
- "aliens" (= data points outside the plot Y limits) are marked by a red arrow (↑ or ↓)
- you can download the data for each parameter set if the 'Data downloads' link shows up
|