|
|
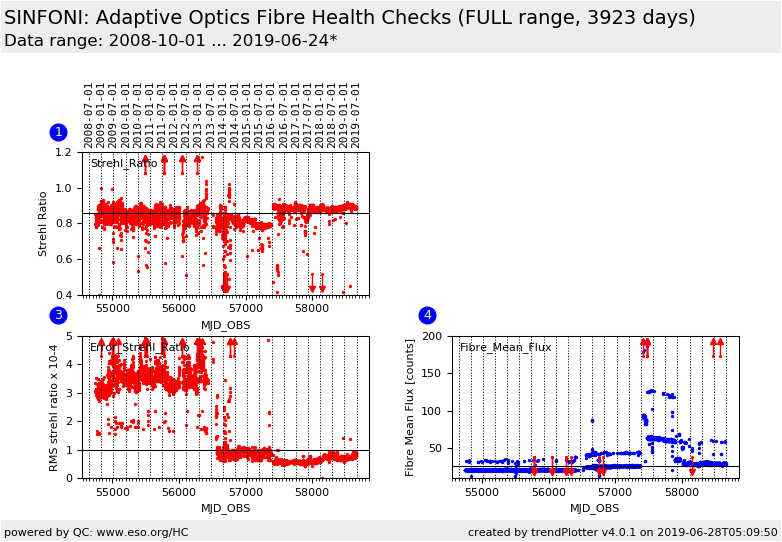
| SINFONI trending system: FULL report |
|
|
| Last update: 2019-06-28T05:09:54 (UT)
(2111d 16h:56m ago)
|
|
|
|
|
*Date on this monitor changes at 21:00 UT |
|

|
|
|
Plot
? |
Symb
? |
Source
* |
Average ? |
Thresholds ? |
N_
data |
QC1
parameter |
Data
downloads |
Remarks |
| method |
value |
unit |
method |
value |
| 1 |
• | QC1DB |
MEDIAN |
0.856 |
unitless |
none | |
3881 |
qc_strehl_med |
all (full time range)
| median strehl ratio of fibre as computed over full K-band. |
| 3 |
• | QC1DB |
MEDIAN |
0.98 |
unitless x 10-4 |
none | |
3881 |
qc_strehl_mederr |
all (full time range)
| rms of median strehl ratio of fibre. |
| 4 |
• | QC1DB |
MEDIAN |
25.9 |
counts |
none | |
3869 |
qc_frmdif_meanflux |
all (full time range)
| average flux level in fibre frame extracted spectrum (counts). |
| |
|
*Data sources: QC1DB: QC1 database; LOCAL: local data source
|
Plot 1
scores: not implemented
| | data source: | sinfoni_hcao
(QC1 database) |
| dataset: | qc_strehl_med | • |
| median: | 0.856 | unitless |
| thresholds: | none | |
| N_data plotted: | 3881 |
| [click plot for closeup] |
Plot 3
scores: not implemented
| | data source: | sinfoni_hcao
(QC1 database) |
| dataset: | qc_strehl_mederr | • |
| median: | 0.98 | unitless x 10-4 |
| thresholds: | none | |
| N_data plotted: | 3881 |
| [click plot for closeup] |
Plot 4
scores: not implemented
| | data source: | sinfoni_hcao
(QC1 database) |
| dataset: | qc_frmdif_meanflux | • |
| median: | 25.9 | counts |
| thresholds: | none | |
| N_data plotted: | 3869 |
| [click plot for closeup] |
Click on any of the plots to see a close-up version.
The latest date is indicated on top of the plot.
If configured,
- data points belonging to the latest date are specially marked
- statistical averages are indicated by a solid line, and thresholds by broken lines
- outliers are marked by a red asterisk. They are defined as data points outside the
threshold lines
- "aliens" (= data points outside the plot Y limits) are marked by a red arrow (↑ or ↓)
- you can download the data for each parameter set if the 'Data downloads' link shows up
|