Plot
? |
Symb
? |
Source
* |
Average ? |
Thresholds ? |
N_
data |
QC1
parameter |
Data
downloads |
Remarks |
| method |
value |
unit |
method |
value |
| 1 |
• | QC1DB |
MEDIAN |
0.582 |
ADU |
VAL | 0.15,1.0 |
41 |
qc_rf1 |
this |
last_yr |
all
|
relative flux (slitlet 1): J-band/250 mas scale |
| 2 |
• | QC1DB |
MEDIAN |
0.572 |
ADU |
VAL | 0.15,1.0 |
66 |
qc_rf1 |
this |
last_yr |
all
|
relative flux (slitlet 1): H-band/250 mas scale |
| 3 |
• | QC1DB |
MEDIAN |
0.569 |
ADU |
VAL | 0.15,1.0 |
41 |
qc_rf1 |
this |
last_yr |
all
|
relative flux (slitlet 1): K-band at the 250 mas camera scale |
| 4 |
• | QC1DB |
MEDIAN |
0.575 |
ADU |
VAL | 0.2,1.0 |
45 |
qc_rf1 |
this |
last_yr |
all
|
relative flux (slitlet 1): H+K-band at the 250 mas camera scale |
|
| 5 |
• | QC1DB |
MEDIAN |
0.359 |
ADU |
VAL | 0.2,1.0 |
2 |
qc_rf1 |
this |
last_yr |
all
|
relative flux (slitlet 1): J-band/ 25 mas scale |
| 6 |
• | QC1DB |
MEDIAN |
0.39 |
ADU |
VAL | 0.2,1.0 |
1 |
qc_rf1 |
this |
last_yr |
all
|
relative flux (slitlet 1): H-band/ 25 mas scale |
| 7 |
• | QC1DB |
MEDIAN |
0.426 |
ADU |
VAL | 0.2,1.0 |
16 |
qc_rf1 |
this |
last_yr |
all
|
relative flux (slitlet 1): K-band at the 25 mas camera scale |
| 8 |
• | QC1DB |
MEDIAN |
0.404 |
ADU |
VAL | 0.2,1.0 |
9 |
qc_rf1 |
this |
last_yr |
all
|
relative flux (slitlet 1): H+K-band at the 25 mas camera scale |
|
| 9 |
• | QC1DB |
MEDIAN |
0.431 |
ADU |
VAL | 0.2,1.0 |
10 |
qc_rf1 |
this |
last_yr |
all
|
relative flux (slitlet 1): J-band/100 mas scale |
| 10 |
• | QC1DB |
MEDIAN |
0.437 |
ADU |
VAL | 0.2,1.0 |
23 |
qc_rf1 |
this |
last_yr |
all
|
relative flux (slitlet 1): H-band/100 mas scale |
| 11 |
• | QC1DB |
MEDIAN |
0.448 |
ADU |
VAL | 0.2,1.0 |
25 |
qc_rf1 |
this |
last_yr |
all
|
relative flux (slitlet 1): K-band at the 100 mas camera scale |
| 12 |
• | QC1DB |
MEDIAN |
0.442 |
ADU |
VAL | 0.2,1.0 |
11 |
qc_rf1 |
this |
last_yr |
all
|
relative flux (slitlet 1): H+K-band at the 100 mas camera scale |
|
| |
|
*Data sources: QC1DB: QC1 database; LOCAL: local text file
|
| Plot 1 | | data source: | sinfoni_flat
(QC1 database) |
| dataset: | qc_rf1 | • |
| median: | 0.582 | ADU |
| fixed thresholds: | 0.15...1.0 | ADU |
| N_data plotted: | 41 |
| [click on plot for closeup] |
| Plot 2 | | data source: | sinfoni_flat
(QC1 database) |
| dataset: | qc_rf1 | • |
| median: | 0.572 | ADU |
| fixed thresholds: | 0.15...1.0 | ADU |
| N_data plotted: | 66 |
| [click on plot for closeup] |
| Plot 3 | | data source: | sinfoni_flat
(QC1 database) |
| dataset: | qc_rf1 | • |
| median: | 0.569 | ADU |
| fixed thresholds: | 0.15...1.0 | ADU |
| N_data plotted: | 41 |
| [click on plot for closeup] |
| Plot 4 | | data source: | sinfoni_flat
(QC1 database) |
| dataset: | qc_rf1 | • |
| median: | 0.575 | ADU |
| fixed thresholds: | 0.2...1.0 | ADU |
| N_data plotted: | 45 |
| [click on plot for closeup] |
| Plot 5 | | data source: | sinfoni_flat
(QC1 database) |
| dataset: | qc_rf1 | • |
| median: | 0.359 | ADU |
| fixed thresholds: | 0.2...1.0 | ADU |
| N_data plotted: | 2 |
| [click on plot for closeup] |
| Plot 6 | | data source: | sinfoni_flat
(QC1 database) |
| dataset: | qc_rf1 | • |
| median: | 0.39 | ADU |
| fixed thresholds: | 0.2...1.0 | ADU |
| N_data plotted: | 1 |
| [click on plot for closeup] |
| Plot 7 | | data source: | sinfoni_flat
(QC1 database) |
| dataset: | qc_rf1 | • |
| median: | 0.426 | ADU |
| fixed thresholds: | 0.2...1.0 | ADU |
| N_data plotted: | 16 |
| [click on plot for closeup] |
| Plot 8 | | data source: | sinfoni_flat
(QC1 database) |
| dataset: | qc_rf1 | • |
| median: | 0.404 | ADU |
| fixed thresholds: | 0.2...1.0 | ADU |
| N_data plotted: | 9 |
| [click on plot for closeup] |
| Plot 9 | | data source: | sinfoni_flat
(QC1 database) |
| dataset: | qc_rf1 | • |
| median: | 0.431 | ADU |
| fixed thresholds: | 0.2...1.0 | ADU |
| N_data plotted: | 10 |
| [click on plot for closeup] |
| Plot 10 | | data source: | sinfoni_flat
(QC1 database) |
| dataset: | qc_rf1 | • |
| median: | 0.437 | ADU |
| fixed thresholds: | 0.2...1.0 | ADU |
| N_data plotted: | 23 |
| [click on plot for closeup] |
| Plot 11 | | data source: | sinfoni_flat
(QC1 database) |
| dataset: | qc_rf1 | • |
| median: | 0.448 | ADU |
| fixed thresholds: | 0.2...1.0 | ADU |
| N_data plotted: | 25 |
| [click on plot for closeup] |
| Plot 12 | | data source: | sinfoni_flat
(QC1 database) |
| dataset: | qc_rf1 | • |
| median: | 0.442 | ADU |
| fixed thresholds: | 0.2...1.0 | ADU |
| N_data plotted: | 11 |
| [click on plot for closeup] |
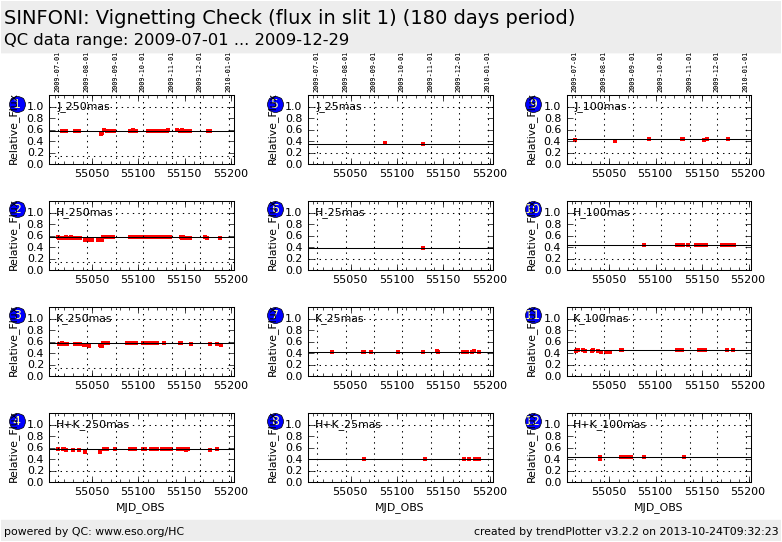
These are the trending plots for the vignetting check computed from the LAMP FLATs.
Slitlets #1 and #32 correspond to the upper-most and the lower-most slitlets in the field-of-view.
As such, these slitlets can be subject to vignetting to the extent that their overall count rates
can be a few 10% lower than for other slitlets.
Following image reconstruction, these slitlets are located on the central part of the detector.
A possible vignetting is monitored by comparing the relative count rates (i.e. the mean counts in
the slitlet #1 or #32 divided by the mean counts in all other slitlets).
This QC1 parameter is most relevant following an instrument intervention.
General information
Click on any of the plots to see a close-up version.
The latest date is indicated on top of the plot, data points belonging to that date are specially marked.
If configured,
- statistical averages are indicated by a solid line, and thresholds by broken lines
- outliers are marked by a red asterisk. They are defined as data points outside the
threshold lines
- "aliens" (= data points outside the plot Y limits) are marked by a red arrow (↑ or ↓)
- you can download the data for each parameter set if the 'Data downloads' link shows up
|
