mirror sites: PL (internal link) HQ     [?]

Health Check monitor


CAL | HC | refs | QC
HealthCheck Monitor
   HOME | UsersGuide
  sl icon ALL INSTRUMENTS
 
all KPI reports
MIDI:
wavelength calib
Other HC:
QC links:
[page auto-refreshes after 60 sec]            [press Ctrl+R to enforce refresh of scores and dates]
[an error occurred while processing this directive]
MIDI trending system: HEALTH CHECK plot
Last update: 2008-12-08T09:02:22 (UT)
| now: 2024-07-17T10:59:41 (UT)
scores active INFO USERS-GUIDE MORE
last OPSLOG data:
2008-12-08
Plot: 1 2 3 4 5 6   latest_files
[an error occurred while processing this directive]
N_data: number of recent OPSLOG entries plotted here
N_data: 52 52 52 52 52 52 availability
less ... | history ... | plot tutorial ... | contact               [?]
Print: Information and research: News:
- png file - advanced studies: QC1 browser | QC1 plotter
[an error occurred while processing this directive]
 
Plot
?
Symb
?
Source
*
OPS?
**
Average ? Thresholds ? N_
data
QC1
parameter
Data
downloads
Remarks
method value unit method value
1 +QC1DB yes (13) none   NONE VAL0,20 45 prism_ArIII_r1   ArIII_R1
1 QC1DB yes (13) none   NONE VAL0,20 45 prism_ArIII_r2   ArIII_R2
1 [4]QC1DB yes (13) none   NONE VAL0,20 45 prism_ArIII_r3   ArIII_R3
1 *QC1DB yes (13) none   NONE VAL0,20 45 prism_ArIII_r4   ArIII_R4
2 +QC1DB yes (13) none   NONE VAL0,20 45 prism_SIV_r1   SIV_R1
2 QC1DB yes (13) none   NONE VAL0,20 45 prism_SIV_r2   SIV_R2
2 [4]QC1DB yes (13) none   NONE VAL0,20 45 prism_SIV_r3   SIV_R3
2 *QC1DB yes (13) none   NONE VAL0,20 45 prism_SIV_r4   SIV_R4
3 +QC1DB yes (13) none   NONE VAL0,20 45 prism_NeII_r1   NeII_R1
3 QC1DB yes (13) none   NONE VAL0,20 45 prism_NeII_r2   NeII_R2
3 [4]QC1DB yes (13) none   NONE VAL0,20 45 prism_NeII_r3   NeII_R3
3 *QC1DB yes (13) none   NONE VAL0,20 45 prism_NeII_r4   NeII_R4
4 +QC1DB yes (13) none   NONE VAL0,20 46 grism_ArIII_r1   ArIII_R1
4 QC1DB yes (13) none   NONE VAL0,20 46 grism_ArIII_r2   ArIII_R2
4 [4]QC1DB yes (13) none   NONE VAL0,20 46 grism_ArIII_r3   ArIII_R3
4 *QC1DB yes (13) none   NONE VAL0,20 46 grism_ArIII_r4   ArIII_R4
5 +QC1DB yes (13) none   NONE VAL0,20 46 grism_SIV_r1   SIV_R1
5 QC1DB yes (13) none   NONE VAL0,20 46 grism_SIV_r2   SIV_R2
5 [4]QC1DB yes (13) none   NONE VAL0,20 46 grism_SIV_r3   SIV_R3
5 *QC1DB yes (13) none   NONE VAL0,20 46 grism_SIV_r4   SIV_R4
6 +QC1DB yes (13) none   NONE VAL0,20 46 grism_NeII_r1   NeII_R1
6 QC1DB yes (13) none   NONE VAL0,20 46 grism_NeII_r2   NeII_R2
6 [4]QC1DB yes (13) none   NONE VAL0,20 46 grism_NeII_r3   NeII_R3
6 *QC1DB yes (13) none   NONE VAL0,20 46 grism_NeII_r4   NeII_R4
*Data sources: QC1DB: QC1 database; LOCAL: local text file | **OPS: to indicate that OPSLOG data are included
This plot

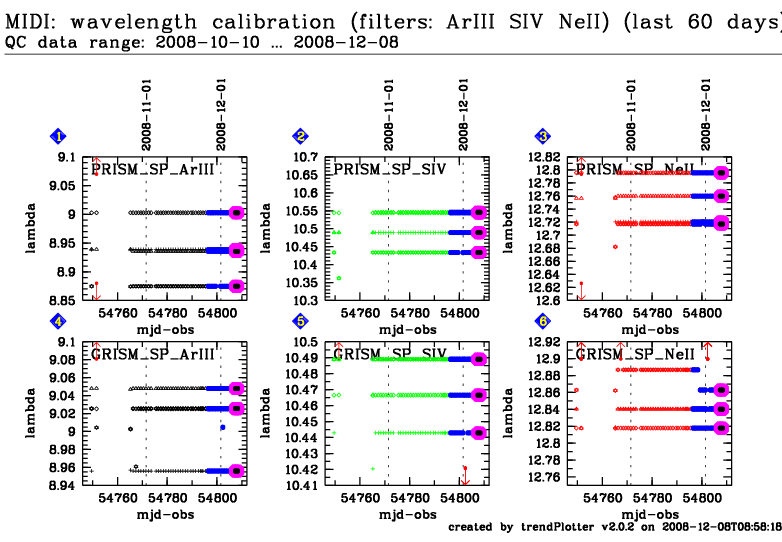
The wavelength day calibration consists in using the MIDI heated blackscreen and taking 3 exposures through different narrow-band filters [NeII], [SIV] and [ArIII] (having central wavelengths accurately measured in the laboratory by the manufacturer). An extra exposure is taken through a polycarbonic foil that has several absorption lines in its N-band spectrum. Exposures without filters and with closed shutter are also taken to process the exposures with filters. From the spectra obtained through the filters a fit of the lambda(X) function is performed. The procedure is performed for each setup (PRISM or GRISM, and SCI_PHOT or HIGH_SENS). The MIDI HIGH_SENS mode uses 2 windows on the detector (R1 and R2). The MIDI SCI_PHOT mode uses 4 windows (R1 to R4) We monitor here the stability of the dispersion by plotting the wavelength of a spectral channel given by the lambda(X) function computed by the reduction of the calibration data. The selected spectral channels corresponds to the expected central wavelength of the three narrow-band filters.  


General information

Click on any of the plots to see a close-up version.

If applicable, the latest values from Paranal ops logs are plotted as blue dots. More information about those values, including a download option, is available in the OPS column.

The latest date is indicated on top of the plot, data points belonging to that date are specially marked.

If configured,

  • statistical averages are indicated by a solid line, and thresholds by broken lines
  • outliers are marked by a red asterisk. They are defined as data points outside the threshold lines
  • "aliens" (= data points outside the plot Y limits) are marked by a red arrow ( or )
  • you can download the data for each parameter set if the 'Data downloads' link shows up