MIDI trending system: HEALTH CHECK report
Last update: 2012-01-25T10:14:01 (UT)
[enable javascript for displaying time difference!]
| now:
2024-07-17T10:54:54
(UT)
General news:
NOTE: The Health Check and calChecker services are moved to qcFlow on an instrument by instrument basis. The current pages will not be updated any longer once the move has been finished.
MIDI news:
Report news:
Plot? Symb? Source OPS? Average ? Thresholds ? N_ QC1 Data Remarks
method value unit method value
1
• QC1DB no MEDIAN 5372.240000 number_counts VAL 4500,7000 86 disp4_number_counts
this |
last_yr |
all
[ARIII] filter with prism
2
• QC1DB no MEDIAN 941.755000 number_counts VAL 700,1300 86 disp4_number_counts
this |
last_yr |
all
[ARIII] filter with grism
3
• QC1DB no MEDIAN 1822.105000 number_counts VAL 1500,2500 86 image1_number_counts
this |
last_yr |
all
[ARIII] filter open
4
• QC1DB no MEDIAN 6644.295000 number_counts VAL 5500,9000 86 image1_number_counts
this |
last_yr |
all
[ARIII] filter open
5
• QC1DB no MEDIAN 8801.775000 number_counts VAL 8000,12000 86 disp5_number_counts
this |
last_yr |
all
[NeII] filter with prism
6
• QC1DB no MEDIAN 1536.605000 number_counts VAL 1000,2400 86 disp5_number_counts
this |
last_yr |
all
[NeII] filter with grism
7
• QC1DB no MEDIAN 3031.165000 number_counts VAL 2800,3800 86 image2_number_counts
this |
last_yr |
all
[NeII] filter open
8
• QC1DB no MEDIAN 11138.935000 number_counts VAL 10500,14000 86 image2_number_counts
this |
last_yr |
all
[NeII] filter open
9
• QC1DB no MEDIAN 8293.525000 number_counts VAL 7500,11000 86 disp6_number_counts
this |
last_yr |
all
[SIV] filter with prism
10
• QC1DB no MEDIAN 1661.875000 number_counts VAL 1000,2500 86 disp6_number_counts
this |
last_yr |
all
[SIV] filter with grism
11
• QC1DB no MEDIAN 2814.535000 number_counts VAL 2500,3800 86 image3_number_counts
this |
last_yr |
all
[SIV] filter open
12
• QC1DB no MEDIAN 9967.100000 number_counts VAL 9000,13000 86 image3_number_counts
this |
last_yr |
all
[SIV] filter open
*Data sources: QC1DB: QC1 database; LOCAL: local text file | **OPS: to indicate that OPSLOG data are included
Plot 1 scores: 8 |
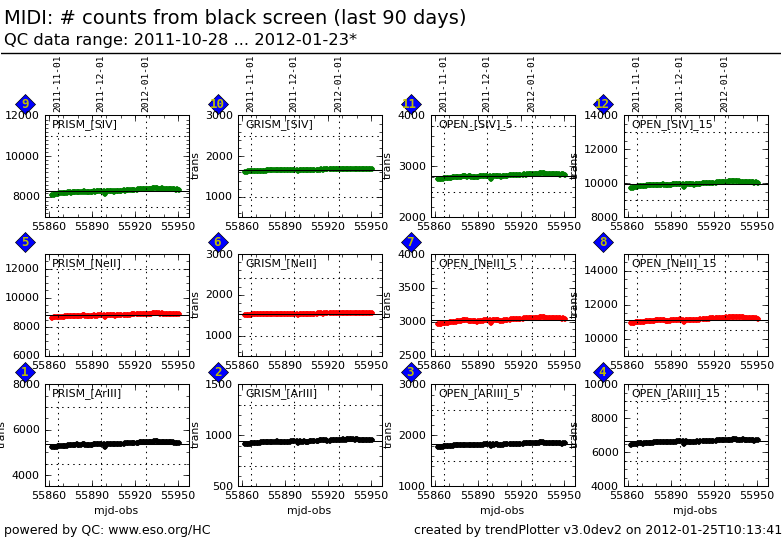
data source: midi_dettrn dataset: disp4_number_counts • median: 5372.240000 number_counts fixed thresholds: 4500.000000...7000.000000 number_counts N_data plotted: 86 [click on plot for closeup]
Plot 2 scores: 8 |
data source: midi_dettrn dataset: disp4_number_counts • median: 941.755000 number_counts fixed thresholds: 700.000000...1300.000000 number_counts N_data plotted: 86 [click on plot for closeup]
Plot 3 scores: not implemented
data source: midi_dettrn dataset: image1_number_counts • median: 1822.105000 number_counts fixed thresholds: 1500.000000...2500.000000 number_counts N_data plotted: 86 [click on plot for closeup]
Plot 4 scores: not implemented
data source: midi_dettrn dataset: image1_number_counts • median: 6644.295000 number_counts fixed thresholds: 5500.000000...9000.000000 number_counts N_data plotted: 86 [click on plot for closeup]
Plot 5 scores: 8 |
data source: midi_dettrn dataset: disp5_number_counts • median: 8801.775000 number_counts fixed thresholds: 8000.000000...12000.000000 number_counts N_data plotted: 86 [click on plot for closeup]
Plot 6 scores: 8 |
data source: midi_dettrn dataset: disp5_number_counts • median: 1536.605000 number_counts fixed thresholds: 1000.000000...2400.000000 number_counts N_data plotted: 86 [click on plot for closeup]
Plot 7 scores: not implemented
data source: midi_dettrn dataset: image2_number_counts • median: 3031.165000 number_counts fixed thresholds: 2800.000000...3800.000000 number_counts N_data plotted: 86 [click on plot for closeup]
Plot 8 scores: not implemented
data source: midi_dettrn dataset: image2_number_counts • median: 11138.935000 number_counts fixed thresholds: 10500.000000...14000.000000 number_counts N_data plotted: 86 [click on plot for closeup]
Plot 9 scores: 8 |
data source: midi_dettrn dataset: disp6_number_counts • median: 8293.525000 number_counts fixed thresholds: 7500.000000...11000.000000 number_counts N_data plotted: 86 [click on plot for closeup]
Plot 10 scores: 8 |
data source: midi_dettrn dataset: disp6_number_counts • median: 1661.875000 number_counts fixed thresholds: 1000.000000...2500.000000 number_counts N_data plotted: 86 [click on plot for closeup]
Plot 11 scores: not implemented
data source: midi_dettrn dataset: image3_number_counts • median: 2814.535000 number_counts fixed thresholds: 2500.000000...3800.000000 number_counts N_data plotted: 86 [click on plot for closeup]
Plot 12 scores: not implemented
data source: midi_dettrn dataset: image3_number_counts • median: 9967.100000 number_counts fixed thresholds: 9000.000000...13000.000000 number_counts N_data plotted: 86 [click on plot for closeup]
This plot
The number of counts is used to calculate the transmission of the dispersive elements. Transmission PRISM=(counts PRISM)/(counts OPEN, DIT=15ms). Transmission GRISM=(counts GRISM)/(counts OPEN, DIT=5ms)
General information
Click on any of the plots to see a close-up version .
The latest date is indicated on top of the plot, data points belonging to that date are specially marked.
If configured,
statistical averages are indicated by a solid line, and thresholds by broken lines outliers are marked by a red asterisk. They are defined as data points outside the
threshold lines "aliens" (= data points outside the plot Y limits) are marked by a red arrow (↑ ↓ you can download the data for each parameter set if the 'Data downloads' link shows up
