mirror sites: PL (internal link) HQ     [?]

Health Check monitor


CAL | HC | refs | QC
HealthCheck Monitor
   HOME | UsersGuide
  sl icon ALL INSTRUMENTS
 
all KPI reports
MIDI:
spectro transmission
Other HC:
QC links:
[an error occurred while processing this directive]
        [page auto-refreshes after 300 sec]   [stop | on]            [press Ctrl+R to enforce refresh of scores and dates]
MIDI trending system: HEALTH CHECK report
Last update: 2012-01-30T09:57:34 (UT)
| now: 2024-06-29T21:33:38 (UT)
HELP USERS-GUIDE MORE
same group: TRANS COUNTS
General news: NOTE: The Health Check and calChecker services are moved to qcFlow on an instrument by instrument basis. The current pages will not be updated any longer once the move has been finished.
The links to KMOS, UVES, and ESPRESSO have been moved to a new section (qcFlow operational) at the lower part of the navigation bar.
MIDI news:  
Report news:  
DATE*: [?] 2015-02-27
report | NLT
2015-02-28
report | NLT
2015-03-01
report | NLT
2015-03-02
report | NLT
2015-03-03
report | NLT
2015-03-04
report | NLT
2015-03-05
no data | NLT
P...
Product quality:
products products products products products products no products
  last OPSLOG data:
2012-01-29*

last files ...
[an error occurred while processing this directive]
monitor
Print: Information and research:
- png file - advanced studies: QC1 browser | QC1 plotter
- general comment: Apparent variations in transmission are usually due to high pressure (see pressure plot)
Plot
?
Symb
?
Source
*
OPS?
**
Average ? Thresholds ? N_
data
QC1
parameter
Data
downloads
Remarks
method value unit method value
1 QC1DB yes (3) MEDIAN 0.80895 NONE VAL0.74,1.00 87 disp4_transmission this | last_yr | all prism [ARIII]
2 QC1DB yes (3) MEDIAN 0.79031 NONE VAL0.76,1.00 87 disp5_transmission this | last_yr | all prism [NeII]
3 QC1DB yes (3) MEDIAN 0.83213 NONE VAL0.78,1.00 87 disp6_transmission this | last_yr | all prism [SIV]
4 QC1DB yes (3) MEDIAN 0.51721 NONE VAL0.4,1.00 87 disp4_transmission this | last_yr | all grism [ARIII]
5 QC1DB yes (3) MEDIAN 0.507 NONE VAL0.4,1.00 87 disp5_transmission this | last_yr | all grism [NeII]
6 QC1DB yes (3) MEDIAN 0.59058 NONE VAL0.4,1.00 87 disp6_transmission this | last_yr | all grism [SIV]
*Data sources: QC1DB: QC1 database; LOCAL: local text file | **OPS: to indicate that OPSLOG data are included
Plot 1
scores: 8|
data source:midi_dettrn
(QC1 database)
dataset:disp4_transmission
median:0.80895NONE
fixed thresholds:0.74...1.0NONE
N_data plotted:87
[click on plot for closeup]
Plot 2
scores: 8|
data source:midi_dettrn
(QC1 database)
dataset:disp5_transmission
median:0.79031NONE
fixed thresholds:0.76...1.0NONE
N_data plotted:87
[click on plot for closeup]
Plot 3
scores: 8|
data source:midi_dettrn
(QC1 database)
dataset:disp6_transmission
median:0.83213NONE
fixed thresholds:0.78...1.0NONE
N_data plotted:87
[click on plot for closeup]
Plot 4
scores: 8|
data source:midi_dettrn
(QC1 database)
dataset:disp4_transmission
median:0.51721NONE
fixed thresholds:0.4...1.0NONE
N_data plotted:87
[click on plot for closeup]
Plot 5
scores: 8|
data source:midi_dettrn
(QC1 database)
dataset:disp5_transmission
median:0.507NONE
fixed thresholds:0.4...1.0NONE
N_data plotted:87
[click on plot for closeup]
Plot 6
scores: 8|
data source:midi_dettrn
(QC1 database)
dataset:disp6_transmission
median:0.59058NONE
fixed thresholds:0.4...1.0NONE
N_data plotted:87
[click on plot for closeup]
This plot

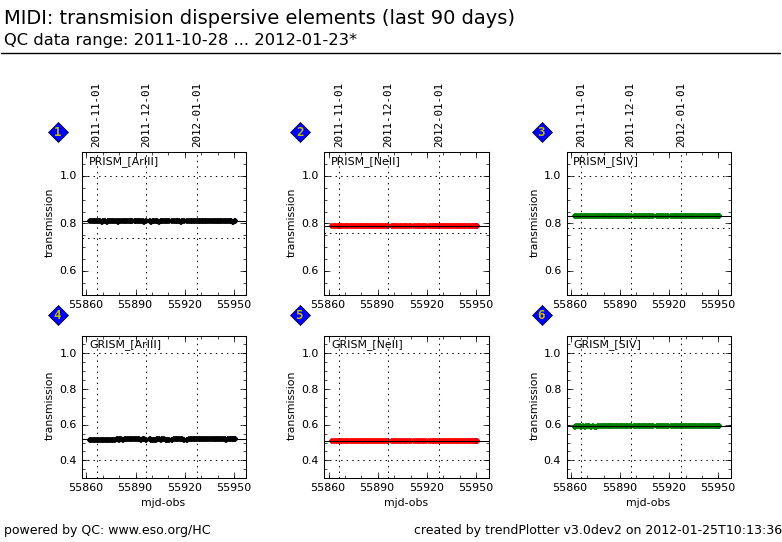
MIDI has 2 dispersive elements a prism (R=30) and a grism (R=230). The transmission of each element is measured through narrow-band filters at three wavelengths (9.00, 10.46 and 12.80 microns). Measurement through the same filters but without the dispersion are also performed to normalize the transmission.  


General information

Click on any of the plots to see a close-up version.

If applicable, the latest values from Paranal ops logs are plotted as blue dots. More information about those values, including a download option, is available in the OPS column.

The latest date is indicated on top of the plot, data points belonging to that date are specially marked.

If configured,

  • statistical averages are indicated by a solid line, and thresholds by broken lines
  • outliers are marked by a red asterisk. They are defined as data points outside the threshold lines
  • "aliens" (= data points outside the plot Y limits) are marked by a red arrow ( or )
  • you can download the data for each parameter set if the 'Data downloads' link shows up