Plot
? |
Symb
? |
Source
* |
OPS?
** |
Average ? |
Thresholds ? |
N_
data |
QC1
parameter |
Data
downloads |
Remarks |
| method |
value |
unit |
method |
value |
| 1 |
• | QC1DB |
yes (0) |
none |
|
ADU |
none | |
13662 |
qc_dark_med |
all (full time range)
| Reset Anomoly, chip 4 |
| 2 |
• | QC1DB |
yes (0) |
none |
|
ADU |
none | |
13666 |
qc_dark_med |
all (full time range)
| Reset Anomoly, chip 3 |
| 3 |
• | QC1DB |
yes (0) |
none |
|
ADU |
none | |
13662 |
qc_dark_med |
all (full time range)
| Reset Anomoly, chip 4 |
| 4 |
• | QC1DB |
yes (0) |
none |
|
ADU |
none | |
13666 |
qc_dark_med |
all (full time range)
| Reset Anomoly, chip 3 |
| 5 |
• | QC1DB |
yes (0) |
none |
|
ADU |
none | |
13672 |
qc_dark_med |
all (full time range)
| Reset Anomoly, chip 1 |
| 6 |
• | QC1DB |
yes (0) |
none |
|
ADU |
none | |
13663 |
qc_dark_med |
all (full time range)
| Reset Anomoly, chip 2 |
| 7 |
• | QC1DB |
yes (0) |
none |
|
ADU |
none | |
13672 |
qc_dark_med |
all (full time range)
| Reset Anomoly, chip 1 |
| 8 |
• | QC1DB |
yes (0) |
none |
|
ADU |
none | |
13663 |
qc_dark_med |
all (full time range)
| Reset Anomoly, chip 2 |
| |
|
*Data sources: QC1DB: QC1 database; LOCAL: local text file | **OPS: OPSLOG data are included
|
Plot 5
scores: not implemented
| | data source: | hawki_dark
(QC1 database) |
| dataset: | qc_dark_med | • |
| average: | none |
| thresholds: | none |
| N_data plotted: | 13672 |
| [click on plot for closeup] |
Plot 6
scores: not implemented
| | data source: | hawki_dark
(QC1 database) |
| dataset: | qc_dark_med | • |
| average: | none |
| thresholds: | none |
| N_data plotted: | 13663 |
| [click on plot for closeup] |
Plot 2
scores: not implemented
| | data source: | hawki_dark
(QC1 database) |
| dataset: | qc_dark_med | • |
| average: | none |
| thresholds: | none |
| N_data plotted: | 13666 |
| [click on plot for closeup] |
Plot 1
scores: not implemented
| | data source: | hawki_dark
(QC1 database) |
| dataset: | qc_dark_med | • |
| average: | none |
| thresholds: | none |
| N_data plotted: | 13662 |
| [click on plot for closeup] |
Plot 7
scores: not implemented
| | data source: | hawki_dark
(QC1 database) |
| dataset: | qc_dark_med | • |
| average: | none |
| thresholds: | none |
| N_data plotted: | 13672 |
| [click on plot for closeup] |
Plot 8
scores: not implemented
| | data source: | hawki_dark
(QC1 database) |
| dataset: | qc_dark_med | • |
| average: | none |
| thresholds: | none |
| N_data plotted: | 13663 |
| [click on plot for closeup] |
Plot 4
scores: not implemented
| | data source: | hawki_dark
(QC1 database) |
| dataset: | qc_dark_med | • |
| average: | none |
| thresholds: | none |
| N_data plotted: | 13666 |
| [click on plot for closeup] |
Plot 3
scores: not implemented
| | data source: | hawki_dark
(QC1 database) |
| dataset: | qc_dark_med | • |
| average: | none |
| thresholds: | none |
| N_data plotted: | 13662 |
| [click on plot for closeup] |
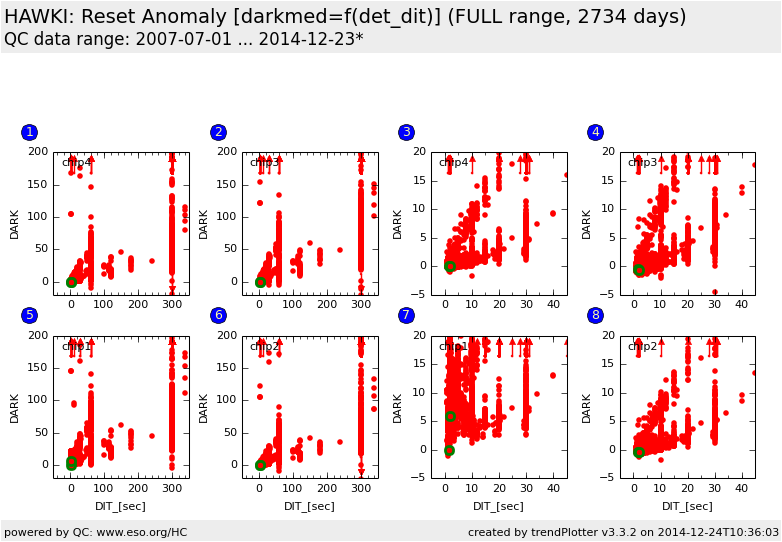
Trending report for the so-called Reset Anomoly.
The Reset Anomoly is a feature of certain detectors whereby after the
detector reset there is a period of time during which the rate of dark
current accumulation varies before settling into a (more or less)
constant rate of accumulation, e.g. as see in
ISAAC.
HAWK-I apparently does NOT suffer from a Reset Anomoly as seen in this report.
Each plot displays the median of the DARK as a function of DIT
Name:
Fits header: DET.DIT and QC.RAW.MEDIAN.MEAN
QC1 DB: det_dit and qc_dark_med in hawki_dark.
Description:
The mean of the raw dark medians is plotted as a function of Detector
Integration Time (DIT).
Setup:
All DITs
These plots describe:
Fig. 1. chip4: The QC parameter QC.RAW.MEDIAN.MEAN as a funtion of DET.DIT for chip #4.
Fig. 2. chip4: The QC parameter QC.RAW.MEDIAN.MEAN as a funtion of DET.DIT for chip #3.
Fig. 5. chip4: The QC parameter QC.RAW.MEDIAN.MEAN as a funtion of DET.DIT for chip #1.
Fig. 6. chip4: The QC parameter QC.RAW.MEDIAN.MEAN as a funtion of DET.DIT for chip #2.
Fig. 3. chip1: Same as Fig. 1, but showing the detail for DET.DIT less than 45 sec.
Fig. 4. chip1: Same as Fig. 2, but showing the detail for DET.DIT less than 45 sec.
Fig. 7. chip1: Same as Fig. 5, but showing the detail for DET.DIT less than 45 sec.
Fig. 8. chip1: Same as Fig. 6, but showing the detail for DET.DIT less than 45 sec.
Find more information on the HAWKI DARK calibration tutorial page.
General information
Click on any of the plots to see a close-up version.
If applicable, the latest values from Paranal ops logs are plotted as blue dots. More information about those values, including a download option, is available in the OPS column.
The latest date is indicated on top of the plot, data points belonging to that date are specially marked.
If configured,
- statistical averages are indicated by a solid line, and thresholds by broken lines
- outliers are marked by a red asterisk. They are defined as data points outside the
threshold lines
- "aliens" (= data points outside the plot Y limits) are marked by a red arrow (↑ or ↓)
- you can download the data for each parameter set if the 'Data downloads' link shows up
|

