Plot
? |
Symb
? |
Source
* |
Average ? |
Thresholds ? |
N_
data |
QC1
parameter |
Data
downloads |
Remarks |
| method |
value |
unit |
method |
value |
| 5 |
• | QC1DB |
MEDIAN |
13.94854 |
ADU |
OFF | ± 15.0 |
178 |
qc_dark_med |
this |
last_yr |
all
|
median dark level, chip 1, DIT=60.0 |
| 6 |
• | QC1DB |
MEDIAN |
9.45 |
ADU |
OFF | ± 15.0 |
178 |
qc_dark_med |
this |
last_yr |
all
|
median dark level, chip 2, DIT=60.0 |
| 2 |
• | QC1DB |
MEDIAN |
14.38164 |
ADU |
OFF | ± 15.0 |
178 |
qc_dark_med |
this |
last_yr |
all
|
median dark level, chip 3, DIT=60.0 |
| 1 |
• | QC1DB |
MEDIAN |
9.87928 |
ADU |
OFF | ± 15.0 |
178 |
qc_dark_med |
this |
last_yr |
all
|
median dark level, chip 4, DIT=60.0 |
| 7 |
• | QC1DB |
MEDIAN |
74.09888 |
ADU |
OFF | ± 70.0 |
177 |
qc_dark_med |
this |
last_yr |
all
|
median dark level, chip 1, DIT=300 |
| 8 |
• | QC1DB |
MEDIAN |
51.98005 |
ADU |
OFF | ± 70.0 |
177 |
qc_dark_med |
this |
last_yr |
all
|
median dark level, chip 2, DIT=300 |
| 4 |
• | QC1DB |
MEDIAN |
76.62749 |
ADU |
OFF | ± 70.0 |
177 |
qc_dark_med |
this |
last_yr |
all
|
median dark level, chip 3, DIT=300 |
| 3 |
• | QC1DB |
MEDIAN |
52.63606 |
ADU |
OFF | ± 70.0 |
177 |
qc_dark_med |
this |
last_yr |
all
|
median dark level, chip 4, DIT=300 |
| |
|
*Data sources: QC1DB: QC1 database; LOCAL: local text file
|
| Plot 5 | | data source: | hawki_dark
(QC1 database) |
| dataset: | qc_dark_med | • |
| median: | 13.94854 | ADU |
| rel. thresholds: | -1.05146...28.94854 | ADU |
| N_data plotted: | 178 |
| [click on plot for closeup] |
| Plot 6 | | data source: | hawki_dark
(QC1 database) |
| dataset: | qc_dark_med | • |
| median: | 9.45 | ADU |
| rel. thresholds: | -5.55...24.45 | ADU |
| N_data plotted: | 178 |
| [click on plot for closeup] |
| Plot 2 | | data source: | hawki_dark
(QC1 database) |
| dataset: | qc_dark_med | • |
| median: | 14.38164 | ADU |
| rel. thresholds: | -0.61836...29.38165 | ADU |
| N_data plotted: | 178 |
| [click on plot for closeup] |
| Plot 1 | | data source: | hawki_dark
(QC1 database) |
| dataset: | qc_dark_med | • |
| median: | 9.87928 | ADU |
| rel. thresholds: | -5.12072...24.87928 | ADU |
| N_data plotted: | 178 |
| [click on plot for closeup] |
| Plot 7 | | data source: | hawki_dark
(QC1 database) |
| dataset: | qc_dark_med | • |
| median: | 74.09888 | ADU |
| rel. thresholds: | 4.09888...144.09888 | ADU |
| N_data plotted: | 177 |
| [click on plot for closeup] |
| Plot 8 | | data source: | hawki_dark
(QC1 database) |
| dataset: | qc_dark_med | • |
| median: | 51.98005 | ADU |
| rel. thresholds: | -18.01995...121.98004 | ADU |
| N_data plotted: | 177 |
| [click on plot for closeup] |
| Plot 4 | | data source: | hawki_dark
(QC1 database) |
| dataset: | qc_dark_med | • |
| median: | 76.62749 | ADU |
| rel. thresholds: | 6.62749...146.6275 | ADU |
| N_data plotted: | 177 |
| [click on plot for closeup] |
| Plot 3 | | data source: | hawki_dark
(QC1 database) |
| dataset: | qc_dark_med | • |
| median: | 52.63606 | ADU |
| rel. thresholds: | -17.36394...122.63606 | ADU |
| N_data plotted: | 177 |
| [click on plot for closeup] |
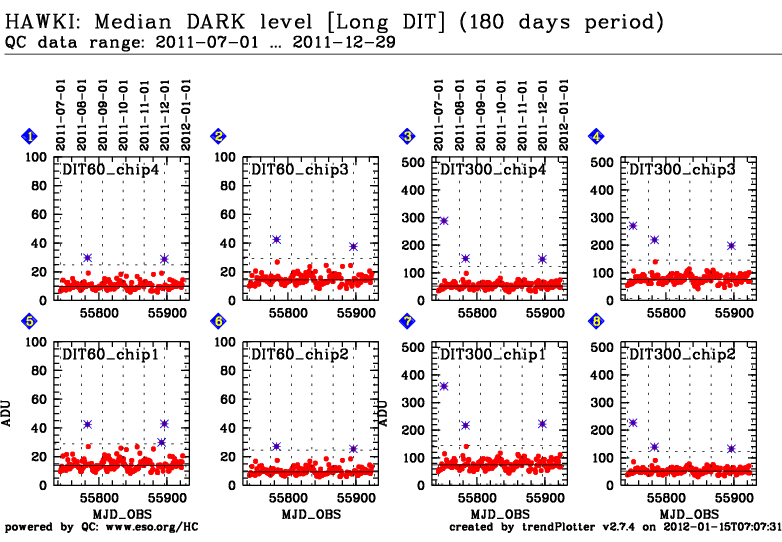
Trending report for median value across master dark.
QC parameter is derived for each detector of the raw dark frames.
On 2016-11-19 (blue vertical line) new CASU pipeline was adopted.
Name:
Fits header: QC.RAW.MEDIAN.MEAN,
QC1 DB: qc_dark_med
Description:
The mean of the raw dark medians.
Setup:
DET.DIT=2.0
DET.DIT=300.0
These plots describe:
Fig. 1. chip4: The QC parameter for DIT=2.0 for chip #4.
Fig. 2. chip3: The QC parameter for DIT=2.0 for chip #3.
Fig. 3. chip4: The QC parameter for DIT=300.0 for chip #4.
Fig. 4. chip3: The QC parameter for DIT=300.0 for chip #3.
Fig. 5. chip1: The QC parameter for DIT=2.0 for chip #1.
Fig. 6. chip2: The QC parameter for DIT=2.0 for chip #2.
Fig. 7. chip1: The QC parameter for DIT=300.0 for chip #1.
Fig. 8. chip2: The QC parameter for DIT=300.0 for chip #2.
Find more information on the HAWKI DARK calibration tutorial page.
General information
Click on any of the plots to see a close-up version.
The latest date is indicated on top of the plot, data points belonging to that date are specially marked.
If configured,
- statistical averages are indicated by a solid line, and thresholds by broken lines
- outliers are marked by a red asterisk. They are defined as data points outside the
threshold lines
- "aliens" (= data points outside the plot Y limits) are marked by a red arrow (↑ or ↓)
- you can download the data for each parameter set if the 'Data downloads' link shows up
|
