Plot
? |
Symb
? |
Source
* |
Average ? |
Thresholds ? |
N_
data |
QC1
parameter |
Data
downloads |
Remarks |
| method |
value |
unit |
method |
value |
| 5 |
• | QC1DB |
MEDIAN |
6.4625 |
ADU |
OFF | ± 1.5 |
97 |
qc_dark_med |
this |
last_yr |
all
|
median dark level, chip 1, DIT=2.0 |
| 6 |
• | QC1DB |
MEDIAN |
-0.2875 |
ADU |
OFF | ± 1.5 |
97 |
qc_dark_med |
this |
last_yr |
all
|
median dark level, chip 2, DIT=2.0 |
| 2 |
• | QC1DB |
MEDIAN |
-0.525 |
ADU |
OFF | ± 1.5 |
97 |
qc_dark_med |
this |
last_yr |
all
|
median dark level, chip 3, DIT=2.0 |
| 1 |
• | QC1DB |
MEDIAN |
0.025 |
ADU |
OFF | ± 1.5 |
97 |
qc_dark_med |
this |
last_yr |
all
|
median dark level, chip 4, DIT=2.0 |
| 7 |
• | QC1DB |
MEDIAN |
76.6262 |
ADU |
OFF | ± 70.0 |
87 |
qc_dark_med |
this |
last_yr |
all
|
median dark level, chip 1, DIT=300 |
| 8 |
• | QC1DB |
MEDIAN |
52.85881 |
ADU |
OFF | ± 70.0 |
87 |
qc_dark_med |
this |
last_yr |
all
|
median dark level, chip 2, DIT=300 |
| 4 |
• | QC1DB |
MEDIAN |
76.98862 |
ADU |
OFF | ± 70.0 |
87 |
qc_dark_med |
this |
last_yr |
all
|
median dark level, chip 3, DIT=300 |
| 3 |
• | QC1DB |
MEDIAN |
54.62622 |
ADU |
OFF | ± 70.0 |
87 |
qc_dark_med |
this |
last_yr |
all
|
median dark level, chip 4, DIT=300 |
| |
|
*Data sources: QC1DB: QC1 database; LOCAL: local text file
|
| Plot 5 | | data source: | hawki_dark
(QC1 database) |
| dataset: | qc_dark_med | • |
| median: | 6.4625 | ADU |
| rel. thresholds: | 4.9625...7.9625 | ADU |
| N_data plotted: | 97 |
| [click on plot for closeup] |
| Plot 6 | | data source: | hawki_dark
(QC1 database) |
| dataset: | qc_dark_med | • |
| median: | -0.2875 | ADU |
| rel. thresholds: | -1.7875...1.2125 | ADU |
| N_data plotted: | 97 |
| [click on plot for closeup] |
| Plot 2 | | data source: | hawki_dark
(QC1 database) |
| dataset: | qc_dark_med | • |
| median: | -0.525 | ADU |
| rel. thresholds: | -2.025...0.975 | ADU |
| N_data plotted: | 97 |
| [click on plot for closeup] |
| Plot 1 | | data source: | hawki_dark
(QC1 database) |
| dataset: | qc_dark_med | • |
| median: | 0.025 | ADU |
| rel. thresholds: | -1.475...1.525 | ADU |
| N_data plotted: | 97 |
| [click on plot for closeup] |
| Plot 7 | | data source: | hawki_dark
(QC1 database) |
| dataset: | qc_dark_med | • |
| median: | 76.6262 | ADU |
| rel. thresholds: | 6.6262...146.62619 | ADU |
| N_data plotted: | 87 |
| [click on plot for closeup] |
| Plot 8 | | data source: | hawki_dark
(QC1 database) |
| dataset: | qc_dark_med | • |
| median: | 52.85881 | ADU |
| rel. thresholds: | -17.14119...122.85881 | ADU |
| N_data plotted: | 87 |
| [click on plot for closeup] |
| Plot 4 | | data source: | hawki_dark
(QC1 database) |
| dataset: | qc_dark_med | • |
| median: | 76.98862 | ADU |
| rel. thresholds: | 6.98862...146.98862 | ADU |
| N_data plotted: | 87 |
| [click on plot for closeup] |
| Plot 3 | | data source: | hawki_dark
(QC1 database) |
| dataset: | qc_dark_med | • |
| median: | 54.62622 | ADU |
| rel. thresholds: | -15.37378...124.62622 | ADU |
| N_data plotted: | 87 |
| [click on plot for closeup] |
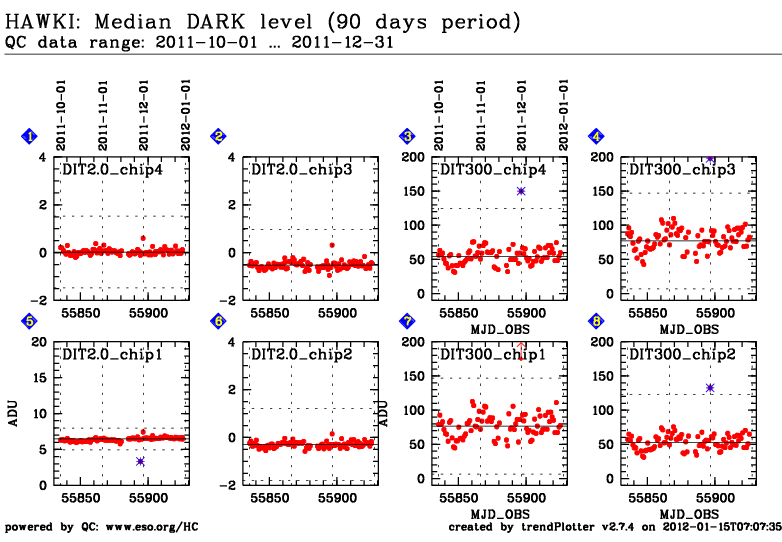
Trending report for median value across master dark.
QC parameter is derived for each detector of the raw dark frames.
On 2016-11-19 (blue vertical line) new CASU pipeline was adopted.
Name:
Fits header: QC.RAW.MEDIAN.MEAN,
QC1 DB: qc_dark_med
Description:
The mean of the raw dark medians.
Setup:
DET.DIT=2.0
DET.DIT=300.0
These plots describe:
Fig. 1. chip4: The QC parameter for DIT=2.0 for chip #4.
Fig. 2. chip3: The QC parameter for DIT=2.0 for chip #3.
Fig. 3. chip4: The QC parameter for DIT=300.0 for chip #4.
Fig. 4. chip3: The QC parameter for DIT=300.0 for chip #3.
Fig. 5. chip1: The QC parameter for DIT=2.0 for chip #1.
Fig. 6. chip2: The QC parameter for DIT=2.0 for chip #2.
Fig. 7. chip1: The QC parameter for DIT=300.0 for chip #1.
Fig. 8. chip2: The QC parameter for DIT=300.0 for chip #2.
Find more information on the HAWKI DARK calibration tutorial page.
General information
Click on any of the plots to see a close-up version.
The latest date is indicated on top of the plot, data points belonging to that date are specially marked.
If configured,
- statistical averages are indicated by a solid line, and thresholds by broken lines
- outliers are marked by a red asterisk. They are defined as data points outside the
threshold lines
- "aliens" (= data points outside the plot Y limits) are marked by a red arrow (↑ or ↓)
- you can download the data for each parameter set if the 'Data downloads' link shows up
|
