Plot
? |
Symb
? |
Source
* |
Average ? |
Thresholds ? |
N_
data |
QC1
parameter |
Data
downloads |
Remarks |
| method |
value |
unit |
method |
value |
| 5 |
• | QC1DB |
MEDIAN |
10.57851 |
ADU |
3SIG | ± 0.1211 |
149 |
qc_ron_mean |
this |
last_yr |
all
|
Mean DARK ReadOut Noise, chip 1, DIT=2.0 |
| 6 |
• | QC1DB |
MEDIAN |
9.34529 |
ADU |
3SIG | ± 0.08037 |
149 |
qc_ron_mean |
this |
last_yr |
all
|
Mean DARK ReadOut Noise, chip 2, DIT=2.0 |
| 2 |
• | QC1DB |
MEDIAN |
8.80362 |
ADU |
3SIG | ± 0.08067 |
149 |
qc_ron_mean |
this |
last_yr |
all
|
Mean DARK ReadOut Noise, chip 3, DIT=2.0 |
| 1 |
• | QC1DB |
MEDIAN |
9.46302 |
ADU |
3SIG | ± 0.12533 |
149 |
qc_ron_mean |
this |
last_yr |
all
|
Mean DARK ReadOut Noise, chip 4, DIT=2.0 |
| 7 |
• | QC1DB |
MEDIAN |
7.20832 |
ADU |
3SIG | ± 1.82674 |
96 |
qc_ron_mean |
this |
last_yr |
all
|
Mean DARK ReadOut Noise, chip 1, DIT=300 |
| 8 |
• | QC1DB |
MEDIAN |
6.32647 |
ADU |
3SIG | ± 1.54653 |
96 |
qc_ron_mean |
this |
last_yr |
all
|
Mean DARK ReadOut Noise, chip 2, DIT=300 |
| 4 |
• | QC1DB |
MEDIAN |
7.07983 |
ADU |
3SIG | ± 1.60497 |
96 |
qc_ron_mean |
this |
last_yr |
all
|
Mean DARK ReadOut Noise, chip 3, DIT=300 |
| 3 |
• | QC1DB |
MEDIAN |
5.79982 |
ADU |
3SIG | ± 1.2886 |
96 |
qc_ron_mean |
this |
last_yr |
all
|
Mean DARK ReadOut Noise, chip 4, DIT=300 |
| |
|
*Data sources: QC1DB: QC1 database; LOCAL: local text file
|
| Plot 5 | | data source: | hawki_dark
(QC1 database) |
| parameter | dataset: | qc_ron_mean | • |
| median: | 10.57851 | ADU |
| rel. thresholds: 3σ | 10.45741...10.69961 | ADU |
| N_data: | 149 |
| [click on plot for closeup] |

| Plot 6 | | data source: | hawki_dark
(QC1 database) |
| parameter | dataset: | qc_ron_mean | • |
| median: | 9.34529 | ADU |
| rel. thresholds: 3σ | 9.26493...9.42566 | ADU |
| N_data: | 149 |
| [click on plot for closeup] |

| Plot 2 | | data source: | hawki_dark
(QC1 database) |
| parameter | dataset: | qc_ron_mean | • |
| median: | 8.80362 | ADU |
| rel. thresholds: 3σ | 8.72296...8.88429 | ADU |
| N_data: | 149 |
| [click on plot for closeup] |

| Plot 1 | | data source: | hawki_dark
(QC1 database) |
| parameter | dataset: | qc_ron_mean | • |
| median: | 9.46302 | ADU |
| rel. thresholds: 3σ | 9.33769...9.58835 | ADU |
| N_data: | 149 |
| [click on plot for closeup] |

| Plot 7 | | data source: | hawki_dark
(QC1 database) |
| parameter | dataset: | qc_ron_mean | • |
| median: | 7.20832 | ADU |
| rel. thresholds: 3σ | 5.38158...9.03507 | ADU |
| N_data: | 96 |
| [click on plot for closeup] |

| Plot 8 | | data source: | hawki_dark
(QC1 database) |
| parameter | dataset: | qc_ron_mean | • |
| median: | 6.32647 | ADU |
| rel. thresholds: 3σ | 4.77995...7.873 | ADU |
| N_data: | 96 |
| [click on plot for closeup] |

| Plot 4 | | data source: | hawki_dark
(QC1 database) |
| parameter | dataset: | qc_ron_mean | • |
| median: | 7.07983 | ADU |
| rel. thresholds: 3σ | 5.47486...8.6848 | ADU |
| N_data: | 96 |
| [click on plot for closeup] |

| Plot 3 | | data source: | hawki_dark
(QC1 database) |
| parameter | dataset: | qc_ron_mean | • |
| median: | 5.79982 | ADU |
| rel. thresholds: 3σ | 4.51121...7.08842 | ADU |
| N_data: | 96 |
| [click on plot for closeup] |

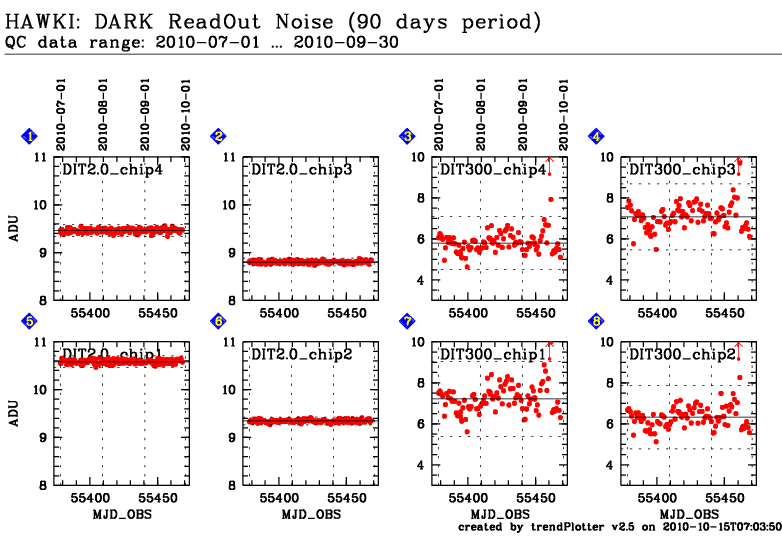
Trending report for ReadOut Noise [RON] of the master dark.
QC parameter is derived for each detector of the raw dark frames.
On 2016-11-19 new CASU pipeline was adopted (blue vertical line).
Name:
Fits header: QC.RON.MEAN,
QC1 DB: qc_ron_mean
Description:
The mean of the raw dark ReadOut Noise estimates.
Setup:
DET.DIT=2.0
DET.DIT=300.0
These plots describe:
Fig. 1. chip4: The QC parameter for DIT=2.0 for chip #4.
Fig. 2. chip3: The QC parameter for DIT=2.0 for chip #3.
Fig. 3. chip4: The QC parameter for DIT=300.0 for chip #4.
Fig. 4. chip3: The QC parameter for DIT=300.0 for chip #3.
Fig. 5. chip1: The QC parameter for DIT=2.0 for chip #1.
Fig. 6. chip2: The QC parameter for DIT=2.0 for chip #2.
Fig. 7. chip1: The QC parameter for DIT=300.0 for chip #1.
Fig. 8. chip2: The QC parameter for DIT=300.0 for chip #2.
Find more information on the HAWKI DARK calibration tutorial page.
General information
Click on any of the plots to see a close-up version.
The latest date is indicated on top of the plot, data points belonging to that date are specially marked.
If configured,
- statistical averages are indicated by a solid line, and thresholds by broken lines
- outliers are marked by a red asterisk. They are defined as data points outside the
threshold lines
- "aliens" (= data points outside the plot Y limits) are marked by a red arrow (↑ or ↓)
- you can download the data for each parameter set if the 'Data downloads' link shows up
|
