Plot
? |
Symb
? |
Source
* |
Average ? |
Thresholds ? |
N_
data |
QC1
parameter |
Data
downloads |
Remarks |
| method |
value |
unit |
method |
value |
| 5 |
• | QC1DB |
MEDIAN |
14.0 |
ADU |
3SIG | ± 4.91285 |
106 |
qc_dark_med |
this |
last_yr |
all
|
median dark level, chip 1, DIT=2.0 |
| 6 |
• | QC1DB |
MEDIAN |
0.83333 |
ADU |
3SIG | ± 0.85999 |
106 |
qc_dark_med |
this |
last_yr |
all
|
median dark level, chip 2, DIT=2.0 |
| 2 |
• | QC1DB |
MEDIAN |
0.83333 |
ADU |
3SIG | ± 1.07575 |
106 |
qc_dark_med |
this |
last_yr |
all
|
median dark level, chip 3, DIT=2.0 |
| 1 |
• | QC1DB |
MEDIAN |
1.13333 |
ADU |
3SIG | ± 0.93677 |
106 |
qc_dark_med |
this |
last_yr |
all
|
median dark level, chip 4, DIT=2.0 |
| 7 |
• | QC1DB |
MEDIAN |
349.68399 |
ADU |
3SIG | ± 166.86087 |
60 |
qc_dark_med |
this |
last_yr |
all
|
median dark level, chip 1, DIT=300 |
| 8 |
• | QC1DB |
MEDIAN |
220.38556 |
ADU |
3SIG | ± 106.07629 |
60 |
qc_dark_med |
this |
last_yr |
all
|
median dark level, chip 2, DIT=300 |
| 4 |
• | QC1DB |
MEDIAN |
317.62051 |
ADU |
3SIG | ± 149.59631 |
60 |
qc_dark_med |
this |
last_yr |
all
|
median dark level, chip 3, DIT=300 |
| 3 |
• | QC1DB |
MEDIAN |
240.96486 |
ADU |
3SIG | ± 115.46418 |
60 |
qc_dark_med |
this |
last_yr |
all
|
median dark level, chip 4, DIT=300 |
| |
|
*Data sources: QC1DB: QC1 database; LOCAL: local text file
|
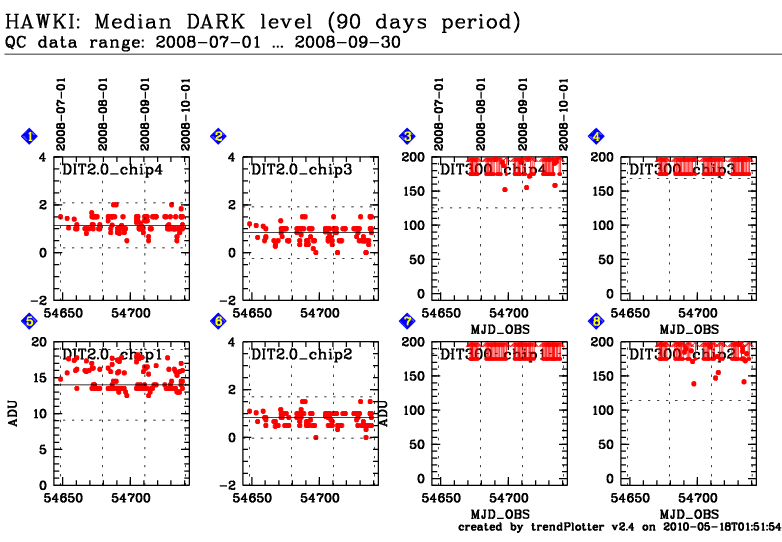
This plot
Trending report for median value across master dark.
QC parameter is derived for each detector of the raw dark frames.
On 2016-11-19 (blue vertical line) new CASU pipeline was adopted.
Name:
Fits header: QC.RAW.MEDIAN.MEAN,
QC1 DB: qc_dark_med
Description:
The mean of the raw dark medians.
Setup:
DET.DIT=2.0
DET.DIT=300.0
These plots describe:
Fig. 1. chip4: The QC parameter for DIT=2.0 for chip #4.
Fig. 2. chip3: The QC parameter for DIT=2.0 for chip #3.
Fig. 3. chip4: The QC parameter for DIT=300.0 for chip #4.
Fig. 4. chip3: The QC parameter for DIT=300.0 for chip #3.
Fig. 5. chip1: The QC parameter for DIT=2.0 for chip #1.
Fig. 6. chip2: The QC parameter for DIT=2.0 for chip #2.
Fig. 7. chip1: The QC parameter for DIT=300.0 for chip #1.
Fig. 8. chip2: The QC parameter for DIT=300.0 for chip #2.
Find more information on the HAWKI DARK calibration tutorial page.
General information
Click on any of the plots to see a close-up version.
The latest date is indicated on top of the plot, data points belonging to that date are specially marked.
If configured,
- statistical averages are indicated by a solid line, and thresholds by broken lines
- outliers are marked by a red asterisk. They are defined as data points outside the
threshold lines
- "aliens" (= data points outside the plot Y limits) are marked by a red arrow (↑ or ↓)
- you can download the data for each parameter set if the 'Data downloads' link shows up
|
