Plot
? |
Symb
? |
Source
* |
Average ? |
Thresholds ? |
N_
data |
QC1
parameter |
Data
downloads |
Remarks |
| method |
value |
unit |
method |
value |
| 1 |
• | QC1DB |
MEDIAN |
1.29 |
pixel |
none | |
15 |
refpos1_ft1 |
this |
last_yr |
all
|
position of reference wavelength 1, SPLIT polarisation, Fringe Tracker (FT) detector, 1st spectrum |
| 2 |
• | QC1DB |
MEDIAN |
490 |
pixel |
VAL | 489,491 |
15 |
refpos1_sc1 |
this |
last_yr |
all
|
position of reference wavelength 1, SPLIT polarisation, Science Camera (SC) detector, 1st spectrum |
| 3 |
• | QC1DB |
MEDIAN |
1.5 |
pixel |
none | |
13 |
refpos1_ft1 |
this |
last_yr |
all
|
position of reference wavelength 1, COMBINED polarisation, Fringe Tracker (FT) detector, 1st spectrum |
| 4 |
• | QC1DB |
MEDIAN |
490 |
pixel |
VAL | 489,491 |
13 |
refpos1_sc1 |
this |
last_yr |
all
|
position of reference wavelength 1, COMBINED polarisation, Science Camera (SC) detector, 1st spectrum |
| 5 |
• | QC1DB |
MEDIAN |
3.67 |
pixel |
none | |
15 |
refpos2_ft1 |
this |
last_yr |
all
|
position of reference wavelength 2, SPLIT polarisation, Fringe Tracker (FT) detector, 1st spectrum |
| 6 |
• | QC1DB |
MEDIAN |
494 |
pixel |
VAL | 493,495 |
15 |
refpos2_sc1 |
this |
last_yr |
all
|
position of reference wavelength 2, SPLIT polarisation, Science Camera (SC) detector, 1st spectrum |
| 7 |
• | QC1DB |
MEDIAN |
3.78 |
pixel |
none | |
13 |
refpos2_ft1 |
this |
last_yr |
all
|
position of reference wavelength 2, COMBINED polarisation, Fringe Tracker (FT) detector, 1st spectrum |
| 8 |
• | QC1DB |
MEDIAN |
494 |
pixel |
VAL | 493,495 |
13 |
refpos2_sc1 |
this |
last_yr |
all
|
position of reference wavelength 2, COMBINED polarisation, Science Camera (SC) detector, 1st spectrum |
| |
|
*Data sources: QC1DB: QC1 database; LOCAL: local data source
|
Plot 1
scores: not implemented
| | data source: | gravity_p2vm
(QC1 database) |
| dataset: | refpos1_ft1 | • |
| median: | 1.29 | pixel |
| thresholds: | none | |
| N_data plotted: | 15 |
| [click on plot for closeup] |
Plot 2
scores:  5| 5|
| | data source: | gravity_p2vm
(QC1 database) |
| dataset: | refpos1_sc1 | • |
| median: | 490 | pixel |
| fixed thresholds: | 489...491 | pixel |
| N_data plotted: | 15 |
| [click on plot for closeup] |
Plot 3
scores: not implemented
| | data source: | gravity_p2vm
(QC1 database) |
| dataset: | refpos1_ft1 | • |
| median: | 1.5 | pixel |
| thresholds: | none | |
| N_data plotted: | 13 |
| [click on plot for closeup] |
Plot 4
scores: 6|
| | data source: | gravity_p2vm
(QC1 database) |
| dataset: | refpos1_sc1 | • |
| median: | 490 | pixel |
| fixed thresholds: | 489...491 | pixel |
| N_data plotted: | 13 |
| [click on plot for closeup] |
Plot 5
scores: not implemented
| | data source: | gravity_p2vm
(QC1 database) |
| dataset: | refpos2_ft1 | • |
| median: | 3.67 | pixel |
| thresholds: | none | |
| N_data plotted: | 15 |
| [click on plot for closeup] |
Plot 6
scores: 5|
| | data source: | gravity_p2vm
(QC1 database) |
| dataset: | refpos2_sc1 | • |
| median: | 494 | pixel |
| fixed thresholds: | 493...495 | pixel |
| N_data plotted: | 15 |
| [click on plot for closeup] |
Plot 7
scores: not implemented
| | data source: | gravity_p2vm
(QC1 database) |
| dataset: | refpos2_ft1 | • |
| median: | 3.78 | pixel |
| thresholds: | none | |
| N_data plotted: | 13 |
| [click on plot for closeup] |
Plot 8
scores: 6|
| | data source: | gravity_p2vm
(QC1 database) |
| dataset: | refpos2_sc1 | • |
| median: | 494 | pixel |
| fixed thresholds: | 493...495 | pixel |
| N_data plotted: | 13 |
| [click on plot for closeup] |
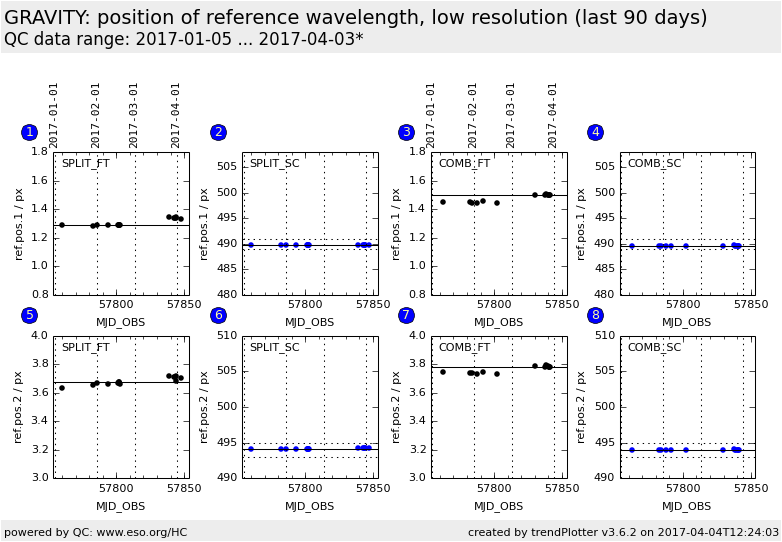
Trending plot for wavelength calibration.
The positions of two reference wavelengths (2.099 and 2.314 microns) on the detectors are trended for
the lowest spectrum on the detector. Scoring thresholds have been set up
provisionally to +/-2 pixels around the median (for SC high
resolution) and +/-1 pixel for SC low and medium resolution.
General information
Click on any of the plots to see a close-up version.
The latest date is indicated on top of the plot.
If configured,
- data points belonging to the latest date are specially marked
- statistical averages are indicated by a solid line, and thresholds by broken lines
- outliers are marked by a red asterisk. They are defined as data points outside the
threshold lines
- "aliens" (= data points outside the plot Y limits) are marked by a red arrow (↑ or ↓)
- you can download the data for each parameter set if the 'Data downloads' link shows up
|
