 mirror sites:
PL (internal link)
HQ
[?]
Quality Control and
Data Processing
|
Pipeline
Pipelines are used at ESO to process both calibration data and science data and to retrieve quality information. There is a dedicated pipeline for each VLT and VLTI instrument. Find general information about ESO reduction pipelines here. The main functionalities of the pipelines are:
For selected instrument modes, we offer science-grade data products processed with the pipelines.
There are two instances of the data reduction pipelines:
The optimized mode is the mode, which uses all data of a night, including the daytime calibrations. The calibration data are sorted and grouped according to their dependencies. Master calibration data are created. Their quality is checked.
The GIRAFFE pipeline supports both the old and the current CCD, with some modified static calibration files describing the changes in alignment. The geometry of the old CCD is the same as for the current one, 2kx4k. The current CCD features increased efficiency in the red, and reduced fringing. It is in operations since 2008-05-26. The GIRAFFE pipeline is publicly available here. Under this link you also find the pipeline Users Manual.
Find the description of GIRAFFE data processing and pipeline recipes for calibrations here and for science data here. The pipeline supports almost all GIRAFFE settings, find the list here. For GIRAFFE Medusa1/2 modes, more than 1 million science-grade 1D spectra are available covering the entire data history. They are available on the phase3 archive interface.  Data format
GIRAFFE has a single CCD with 2048 photon-sensitive columns and 4096 rows. To these add 50 pre-scan and 50 post-scan columns. Until 2008-03-13, the CDD was an EEV chip optimized for the blue ("Bruce", also called the "old CCD"). Since 2008-05-26, GIRAFFE has an e2v CCD ("Carreras") with much higher red efficiency and lower fringing (also called the "new CCD"). Find more details about the GIRAFFE CCD format and properties here. GIRAFFE raw frames have 2148x4096 pixels. Pixel size is 15x15 microns. There is only one read-mode available, which is unbinned, low gain. Raw frames have a size of 17.4 MB each. Bruce had three columns with hot pixels, at x=416-418, starting at y=1466. Carreras has none.
Raw data come as FITS files with three header units (HDU). The main plane (HDU1) has the header with all primary keywords and telescope, positioner, detector, observation, instrument etc. keywords, as well as the pixel data. Two extensions (HDU2 and HDU3) host binary tables. The first binary table is the OzPoz table. It includes the association of the objects and the fibre buttons, and also contains fibre positioner keywords. This is the PAF file generated by FPOSS (the fibre positioner observation support software tool), with some OzPoz information added (such as R, Theta and errors). The second binary table contains the fibre description and the association between fibre buttons and fibre position in the slits, and also includes lab-measured fibre transmission values. This table is static. Find here a description of the GIRAFFE binary tables. The User Manual has also a detailed description of the GIRAFFE raw data structure.
Pipeline products have varying formats. Typical for almost all products beyond the extraction step is that the X axis records the fibre index, while the Y coordinate records pixels or wavelength bins. Hence typically there is one column per fibre. More details are described here.  Spectral format
Except for the BIAS and DARK calibration frames, all GIRAFFE data come in a specific data format which is due to the fibre systems being projected onto the detector. The format is described here. The GIRAFFE spectrograph receives light from the fibre positioner called OzPoz. It consists of two plates which are functionally identical. Each plate hosts three fibre systems (Medusa, IFU, UVES), one plate accomodates another IFU system called 'Argus'.
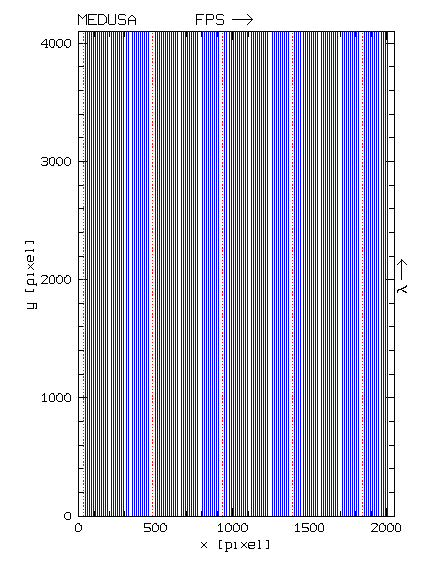
The Medusa system has nominally 137 fibres which are projected into one slit
called Medusa
Find more about the MEDUSA spectral format here.
The IFU fibre system has 320 fibres being projected into one slit called
IFU
Find more about the IFU spectral format here.
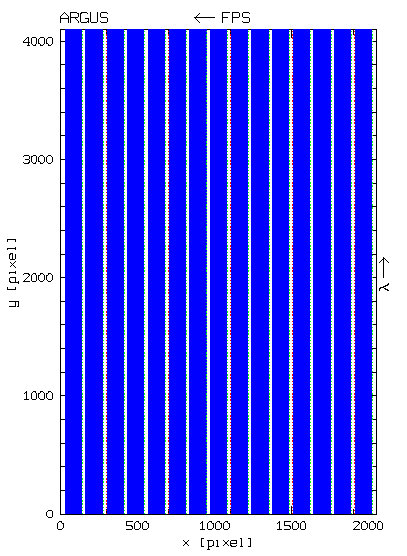
The Argus fibre system is similar to
the IFU system. It also has 15 sky fibres.
Find more about the ARGUS spectral format here.
|
||||||||||||||||||||||||||||||||||||||||||||||||||||||||||||||||||||||||||||||||||||||||||||||||||||||||||||||||||||||||||||||||||||||||||||||||||||||||||||||||||||||||||||||
| |
|||||||||||||||||||||||||||||||||||||||||||||||||||||||||||||||||||||||||||||||||||||||||||||||||||||||||||||||||||||||||||||||||||||||||||||||||||||||||||||||||||||||||||||||
 |
|
||||||||||||||||||||||||||||||||||||||||||||||||||||||||||||||||||||||||||||||||||||||||||||||||||||||||||||||||||||||||||||||||||||||||||||||||||||||||||||||||||||||||||||||


